EUR/USD Price Forecast: Bulls take their chances, 1.1320 is the level to watch

EUR/USD Current price: 1.1223
- The market’s optimism faded on Wednesday with mixed stocks and a weaker USD.
- In the absence of relevant data, attention falls on central bankers’ speeches.
- EUR/USD extends its advance, but buyers need a bit more conviction.
The EUR/USD pair peaked at 1.1265 on Tuesday, surging the most during European trading hours amid broad US Dollar (USD) weakness. The pair retains ground above the 1.1200 threshold early in the American session, advancing for a second consecutive day.
The Greenback turned south as optimism seen at the beginning of the week began fading. An uptick in United States (US) inflation, which remains above the Federal Reserve (Fed) 2% goal, took its toll on the market’s mood, with Asian and European indexes trading mixed after a great start to the week. As per Wall Street, US stocks closed Tuesday mixed, and aim to remain so in the next session.
A scarce macroeconomic calendar leaves sentiment leading the FX board. Meanwhile, central bankers’ speeches from both shores of the Atlantic are hitting the wires, albeit shedding no fresh clues on monetary policy.
EUR/USD short-term technical outlook
The EUR/USD pair still has some room to go before confirming a sustained bullish run. The daily chart shows it keeps advancing below a mildly bearish 20 Simple Moving Average (SMA), providing dynamic resistance at around 1.1320. At the same time, the 100 and 200 SMAs grind higher far below the current level, in line with the longer-term dominant bullish trend. Finally, technical indicators have lost their directional strength right below their midlines, reflecting the latest advance but falling short of anticipating another leg higher.
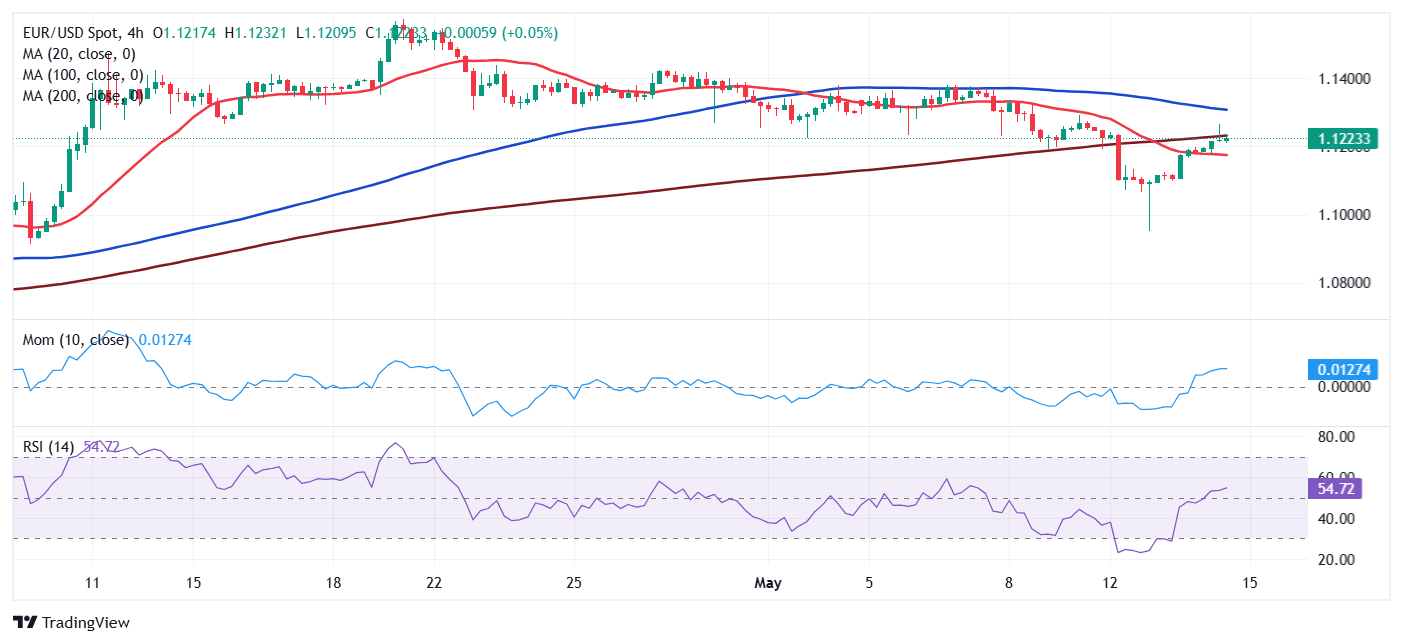
The near-term picture is neutral. The 4-hour chart shows EUR/USD trading around a mildly bullish 200 SMA, while a flat 20 SMA lies at around 1.1175, providing intraday support. As for the 100 SMA, it keeps grinding lower in the 1.1320 region, reinforcing the resistance area. Technical indicators, in the meantime, lack directional strength within neutral levels. Gains beyond the 1.1320 region should open the door for a steeper advance in the upcoming sessions.
Support levels: 1.1175 1.1140 1.1100
Resistance levels: 1.1265 1.1320 1.1350
Premium
You have reached your limit of 3 free articles for this month.
Start your subscription and get access to all our original articles.
Author

Valeria Bednarik
FXStreet
Valeria Bednarik was born and lives in Buenos Aires, Argentina. Her passion for math and numbers pushed her into studying economics in her younger years.


