EUR/USD path of least resistance is to the upside for a change, for now — Confluence Detector

The EUR/USD bounced off the 2018 lows and attempted a recovery. Will it resume its fall? With a dense cluster of support close by, the path of least resistance may be to the upside.
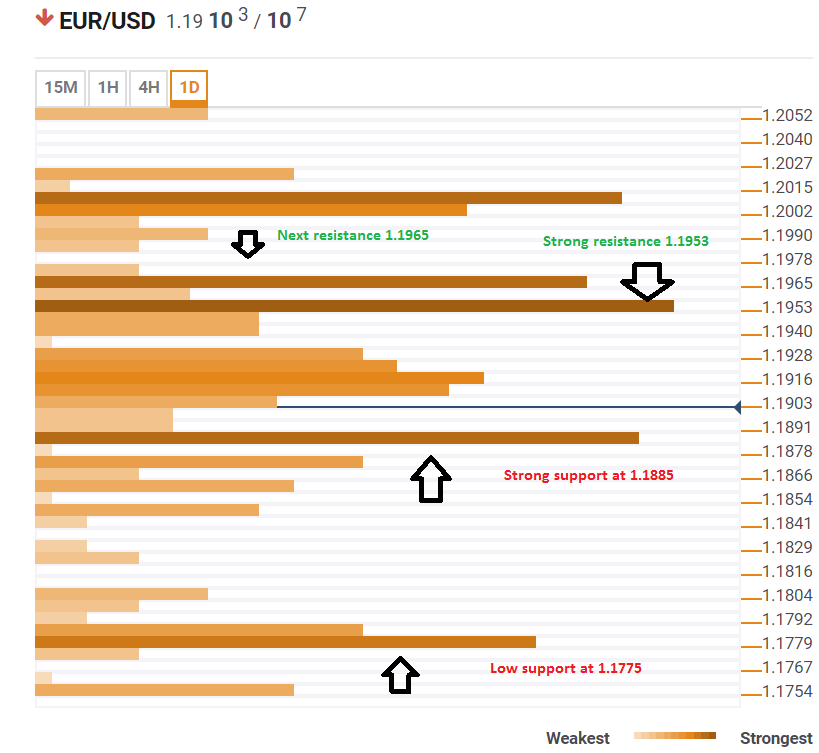
The Technical Confluences Indicator shows that the $1.1885 level is the convergence of the Bolinger Band one-hour Middle (Stdv. 2.2), the Simple Moving Average 15m, the SMA10-4h, the SMA 50-1h and the Fibonacci 61.8% one-day. These potent lines provide lots of support.
A congestion of the same magnitude to the upside appears only at $1.1953 with the one-day high, the Pivot Point one-month Support (a very strong line), and the Simple Moving Average 200-1h.
Rising beyond this line would be hard as the next substantial confluence is close: $1.1965 is the meeting point of the Pivot Point one-day Resistance 1 and the Fibonacci 23.6% one-week.
If the pair does surprise with momentum to go below $1.1885 mentioned earlier, the most robust collection of support levels is only at $1.1775 where the Pivot Point one-week Support 2, the Fibonacci 161.8% one-day, and the Bolinger Band one-day Lower meet.
All in all, at current levels, there is more room to the upside. Yet if the pair has enough momentum to surprise to the downside, it could fall quite fast.
Here is how it looks on the tool:
Confluence Detector
The Confluence Detector finds exciting opportunities using Technical Confluences. The TC is a tool to locate and point out those price levels where there is a congestion of indicators, moving averages, Fibonacci levels, Pivot Points, etc. Knowing where these congestion points are located is very useful for the trader, and can be used as a basis for different strategies.
This tool assigns a certain amount of “weight” to each indicator, and this “weight” can influence adjacents price levels. This means that one price level without any indicator or moving average but under the influence of two “strongly weighted” levels accumulate more resistance than their neighbors. In these cases, the tool signals resistance in apparently empty areas.
Author

Yohay Elam
FXStreet
Yohay is in Forex since 2008 when he founded Forex Crunch, a blog crafted in his free time that turned into a fully-fledged currency website later sold to Finixio.


