EUR/USD needs to break above this resistance level to unleash the upside – Confluence Detector


EUR/USD continues its quiet climb as the focus shifts from Brexit to the Fed decision and Europe's troubles are out of the limelight. Where can it go to? A significant resistance line awaits the pair, but the upside seems more appetizing. 

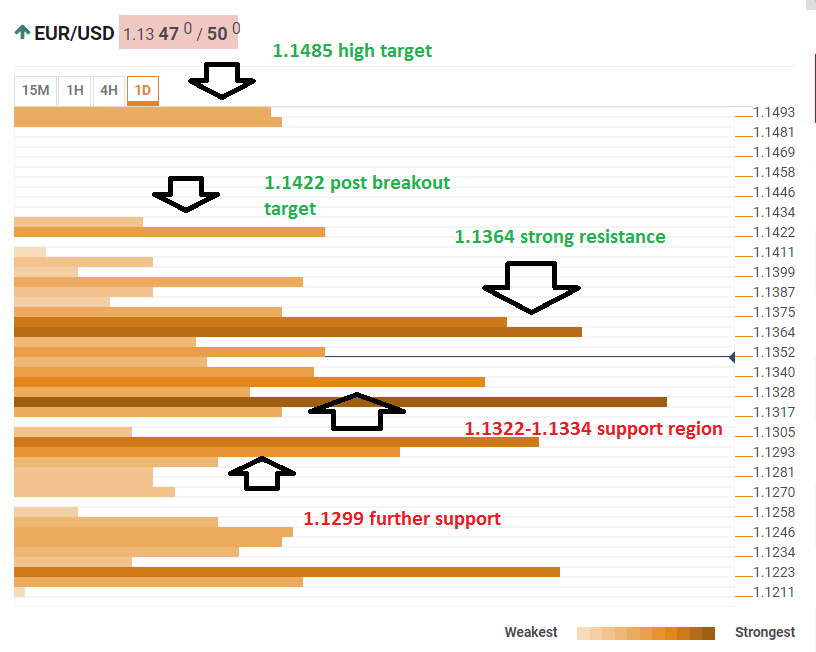
The Technical Confluences Indicator shows that resistance awaits at 1.1364 which is the meeting point of the previous day's high, the Pivot Point one-day Resistance 1, the Simple Moving Average 50-1d, and the SMA 100-1d. 

If the pair breaks higher, the next target is 1.1422 where the Pivot Point one-week R2 meets the Bollinger Band 1d-Upper. 

Even higher, 1.1485 is where the SMA 200-1d and the previous month's high converge.

On the downside, the pair has lots of support. The 1.1322-1.1334 region is a dense cluster consisting of the Fibonacci 38.2% one-month, the SMA 200-15m, the SMA 50-1h, the previous 4h-low, the BB 4h-Middle, the BB 1h-Lower, the SMA 5-1d, the previous day's low, the PP one-day S1, and the BB 1d-Middle. 

Close by, another considerable cushion awaits at 1.1299 where we see the confluence of the Fibonacci 23.6% one-month, the BB 4h-Lower, the Fibonacci 38.2% one-month, the SMA 200-1h, and the Fibonacci 161.8% one-day.

Here is how it looks on the tool:

EUR USD MArch 19 2019 technical chart

Confluence Detector

The Confluence Detector finds exciting opportunities using Technical Confluences. The TC is a tool to locate and point out those price levels where there is a congestion of indicators, moving averages, Fibonacci levels, Pivot Points, etc. Knowing where these congestion points are located is very useful for the trader, and can be used as a basis for different strategies.

This tool assigns a certain amount of “weight” to each indicator, and this “weight” can influence adjacents price levels. These weightings mean that one price level without any indicator or moving average but under the influence of two “strongly weighted” levels accumulate more resistance than their neighbors. In these cases, the tool signals resistance in apparently empty areas.

Learn more about Technical Confluence

Information on these pages contains forward-looking statements that involve risks and uncertainties. Markets and instruments profiled on this page are for informational purposes only and should not in any way come across as a recommendation to buy or sell in these assets. You should do your own thorough research before making any investment decisions. FXStreet does not in any way guarantee that this information is free from mistakes, errors, or material misstatements. It also does not guarantee that this information is of a timely nature. Investing in Open Markets involves a great deal of risk, including the loss of all or a portion of your investment, as well as emotional distress. All risks, losses and costs associated with investing, including total loss of principal, are your responsibility. The views and opinions expressed in this article are those of the authors and do not necessarily reflect the official policy or position of FXStreet nor its advertisers. The author will not be held responsible for information that is found at the end of links posted on this page.

If not otherwise explicitly mentioned in the body of the article, at the time of writing, the author has no position in any stock mentioned in this article and no business relationship with any company mentioned. The author has not received compensation for writing this article, other than from FXStreet.

FXStreet and the author do not provide personalized recommendations. The author makes no representations as to the accuracy, completeness, or suitability of this information. FXStreet and the author will not be liable for any errors, omissions or any losses, injuries or damages arising from this information and its display or use. Errors and omissions excepted.

The author and FXStreet are not registered investment advisors and nothing in this article is intended to be investment advice.

Recommended Content


Recommended Content

Editors’ Picks

AUD/USD remained bid above 0.6500

AUD/USD remained bid above 0.6500

AUD/USD extended further its bullish performance, advancing for the fourth session in a row on Thursday, although a sustainable breakout of the key 200-day SMA at 0.6526 still remain elusive.

AUD/USD News

EUR/USD faces a minor resistance near at 1.0750

EUR/USD faces a minor resistance near at 1.0750

EUR/USD quickly left behind Wednesday’s small downtick and resumed its uptrend north of 1.0700 the figure, always on the back of the persistent sell-off in the US Dollar ahead of key PCE data on Friday.

EUR/USD News

Gold holds around $2,330 after dismal US data

Gold holds around $2,330 after dismal US data

Gold fell below $2,320 in the early American session as US yields shot higher after the data showed a significant increase in the US GDP price deflator in Q1. With safe-haven flows dominating the markets, however, XAU/USD reversed its direction and rose above $2,340.

Gold News

Bitcoin price continues to get rejected from $65K resistance as SEC delays decision on spot BTC ETF options

Bitcoin price continues to get rejected from $65K resistance as SEC delays decision on spot BTC ETF options

Bitcoin (BTC) price has markets in disarray, provoking a broader market crash as it slumped to the $62,000 range on Thursday. Meanwhile, reverberations from spot BTC exchange-traded funds (ETFs) continue to influence the market.

Read more

US economy: slower growth with stronger inflation

US economy: slower growth with stronger inflation

The dollar strengthened, and stocks fell after statistical data from the US. The focus was on the preliminary estimate of GDP for the first quarter. Annualised quarterly growth came in at just 1.6%, down from the 2.5% and 3.4% previously forecast.

Read more

Majors

Cryptocurrencies

Signatures