EUR/USD in a tight range but ready to explode on the Fed decision – Confluence Detector


The EUR/USD is locked between dense clusters of technical levels as tension grows ahead of the all-important decision of the Federal Reserve. Fed Chair Powell and his colleagues are indeed able to send the pair out of range. 

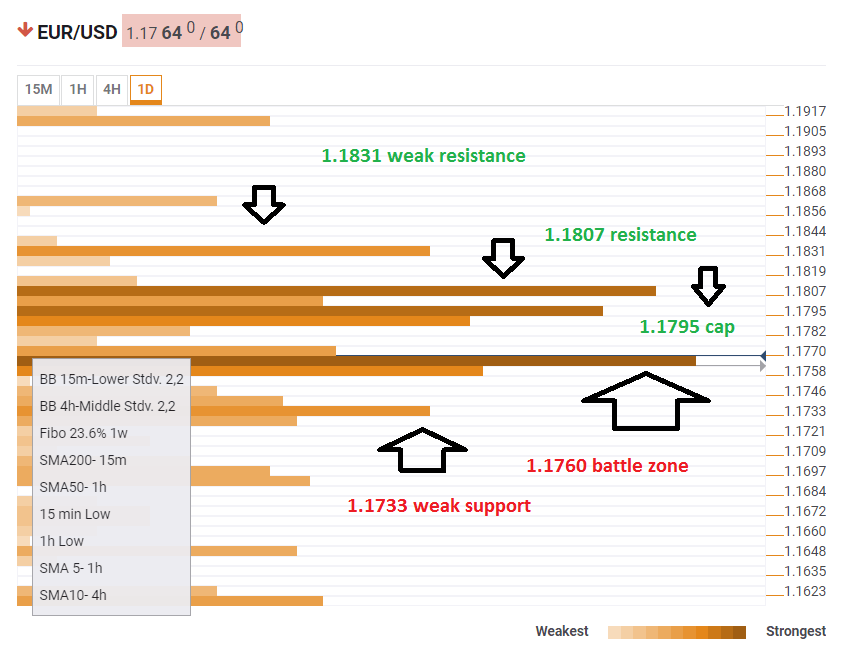
The Technical Confluences Indicator shows that the EUR/USD is battling the 1.1760 area where we see a congestion of the following levels: the Bolinger Band 15m-Lower, the BB 4h-Middle, the Fibonacci 23.6% one-week, the Simple Moving Average 200-15m, the SMA 50-one-hour, the 15m-low, the 1h-low, the SMA 5-1h, and the SMA 10-4h. It is further supported below by the BB 1h-lower, the SMA 100-1h, the Fibonacci 61.8% one-day, and the 4h-low.

Lower, we see weaker support at 1.1733 which is the confluence of the BB 4h-lower, the Fibonacci 38.2% one-week, and the Pivot Point one-day Support 1.

The upside is quite dense as well. At 1.1795 we see the convergence of the Pivot Point one-month Resistance 1, the one-day high, the BB 1h-Upper, the BB 4h-Upper, and the BB one-day Upper. 

Close by, at 1.1807 we see the convergence of the monthly high, the weekly high, PP one-day Resistance 1.

Weak resistance then awaits at 1.1831 which is the convergence of the PP one-day Resistance 2, and the PP one-week R1.

Here is how it looks on the tool:

EUR USD Technical confluence September 26 2018

Confluence Detector

The Confluence Detector finds exciting opportunities using Technical Confluences. The TC is a tool to locate and point out those price levels where there is a congestion of indicators, moving averages, Fibonacci levels, Pivot Points, etc. Knowing where these congestion points are located is very useful for the trader, and can be used as a basis for different strategies.

This tool assigns a certain amount of “weight” to each indicator, and this “weight” can influence adjacents price levels. These weightings mean that one price level without any indicator or moving average but under the influence of two “strongly weighted” levels accumulate more resistance than their neighbors. In these cases, the tool signals resistance in apparently empty areas.

Learn more about Technical Confluence

Information on these pages contains forward-looking statements that involve risks and uncertainties. Markets and instruments profiled on this page are for informational purposes only and should not in any way come across as a recommendation to buy or sell in these assets. You should do your own thorough research before making any investment decisions. FXStreet does not in any way guarantee that this information is free from mistakes, errors, or material misstatements. It also does not guarantee that this information is of a timely nature. Investing in Open Markets involves a great deal of risk, including the loss of all or a portion of your investment, as well as emotional distress. All risks, losses and costs associated with investing, including total loss of principal, are your responsibility. The views and opinions expressed in this article are those of the authors and do not necessarily reflect the official policy or position of FXStreet nor its advertisers. The author will not be held responsible for information that is found at the end of links posted on this page.

If not otherwise explicitly mentioned in the body of the article, at the time of writing, the author has no position in any stock mentioned in this article and no business relationship with any company mentioned. The author has not received compensation for writing this article, other than from FXStreet.

FXStreet and the author do not provide personalized recommendations. The author makes no representations as to the accuracy, completeness, or suitability of this information. FXStreet and the author will not be liable for any errors, omissions or any losses, injuries or damages arising from this information and its display or use. Errors and omissions excepted.

The author and FXStreet are not registered investment advisors and nothing in this article is intended to be investment advice.

Recommended Content


Recommended Content

Editors’ Picks

EUR/USD holds above 1.0700 after German inflation data

EUR/USD holds above 1.0700 after German inflation data

EUR/USD trades modestly higher on the day above 1.0700. The data from Germany showed that the annual HICP inflation edged higher to 2.4% in April. This reading came in above the market expectation of 2.3% and helped the Euro hold its ground.

EUR/USD News

USD/JPY recovers above 156.00 following suspected intervention

USD/JPY recovers above 156.00 following suspected intervention

USD/JPY recovers ground and trades above 156.00 after sliding to 154.50 on what seemed like a Japanese FX intervention. Later this week, Federal Reserve's policy decisions and US employment data could trigger the next big action.

USD/JPY News

Gold holds steady above $2,330 to start the week

Gold holds steady above $2,330 to start the week

Gold fluctuates in a relatively tight channel above $2,330 on Monday. The benchmark 10-year US Treasury bond yield corrects lower and helps XAU/USD limit its losses ahead of this week's key Fed policy meeting.

Gold News

Week Ahead: Bitcoin could surprise investors this week Premium

Week Ahead: Bitcoin could surprise investors this week

Two main macroeconomic events this week could attempt to sway the crypto markets. Bitcoin (BTC), which showed strength last week, has slipped into a short-term consolidation. 

Read more

Five Fundamentals for the week: Fed fears, Nonfarm Payrolls, Middle East promise an explosive week Premium

Five Fundamentals for the week: Fed fears, Nonfarm Payrolls, Middle East promise an explosive week

Higher inflation is set to push Fed Chair Powell and his colleagues to a hawkish decision. Nonfarm Payrolls are set to rock markets, but the ISM Services PMI released immediately afterward could steal the show.

Read more

Majors

Cryptocurrencies

Signatures