|

EUR/USD has gained approximately 6.5% since our buy entry in May

As our members know we have had many profitable trading setups recently. In this technical article, we are going to talk about another Elliott Wave trading setup we got in EURUSD . The forex pair has gained approximately 6.5%  since we bought it in May. EURUSD has completed its correction exactly at the Equal Legs zone, also known as the Blue Box Area. In this article, we’ll break down the Elliott Wave Forecast and explain the trading setup in detail.

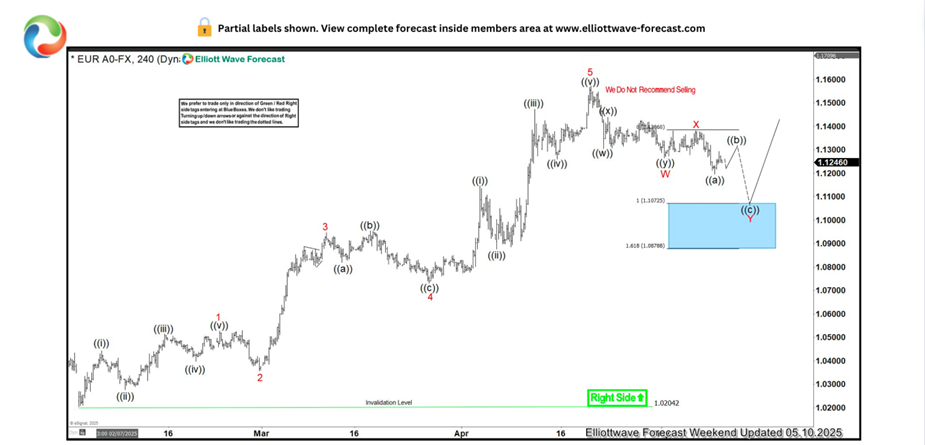
EUR/USD Elliott Wave four-hour chart 05.10.2025

EURUSD continues to show a lower-low sequence from the recent high. So far, we can identify five swings, which points to an incomplete corrective structure. Price action indicates a WXY double three pattern is in progress.The correction hasn’t finished yet, and we expect one more leg down toward the 1.10725 – 1.08788 (buying zone), where we’re looking to rejoin the bullish trend. We do not recommend selling EURUSD, as the main trend remains bullish. From the Blue Box area, we expect a further rally toward new highs. Once the pair hits the 50% Fibonacci retracement from the red X connector, we’ll move the stop to breakeven and secure partial profits.

Chart

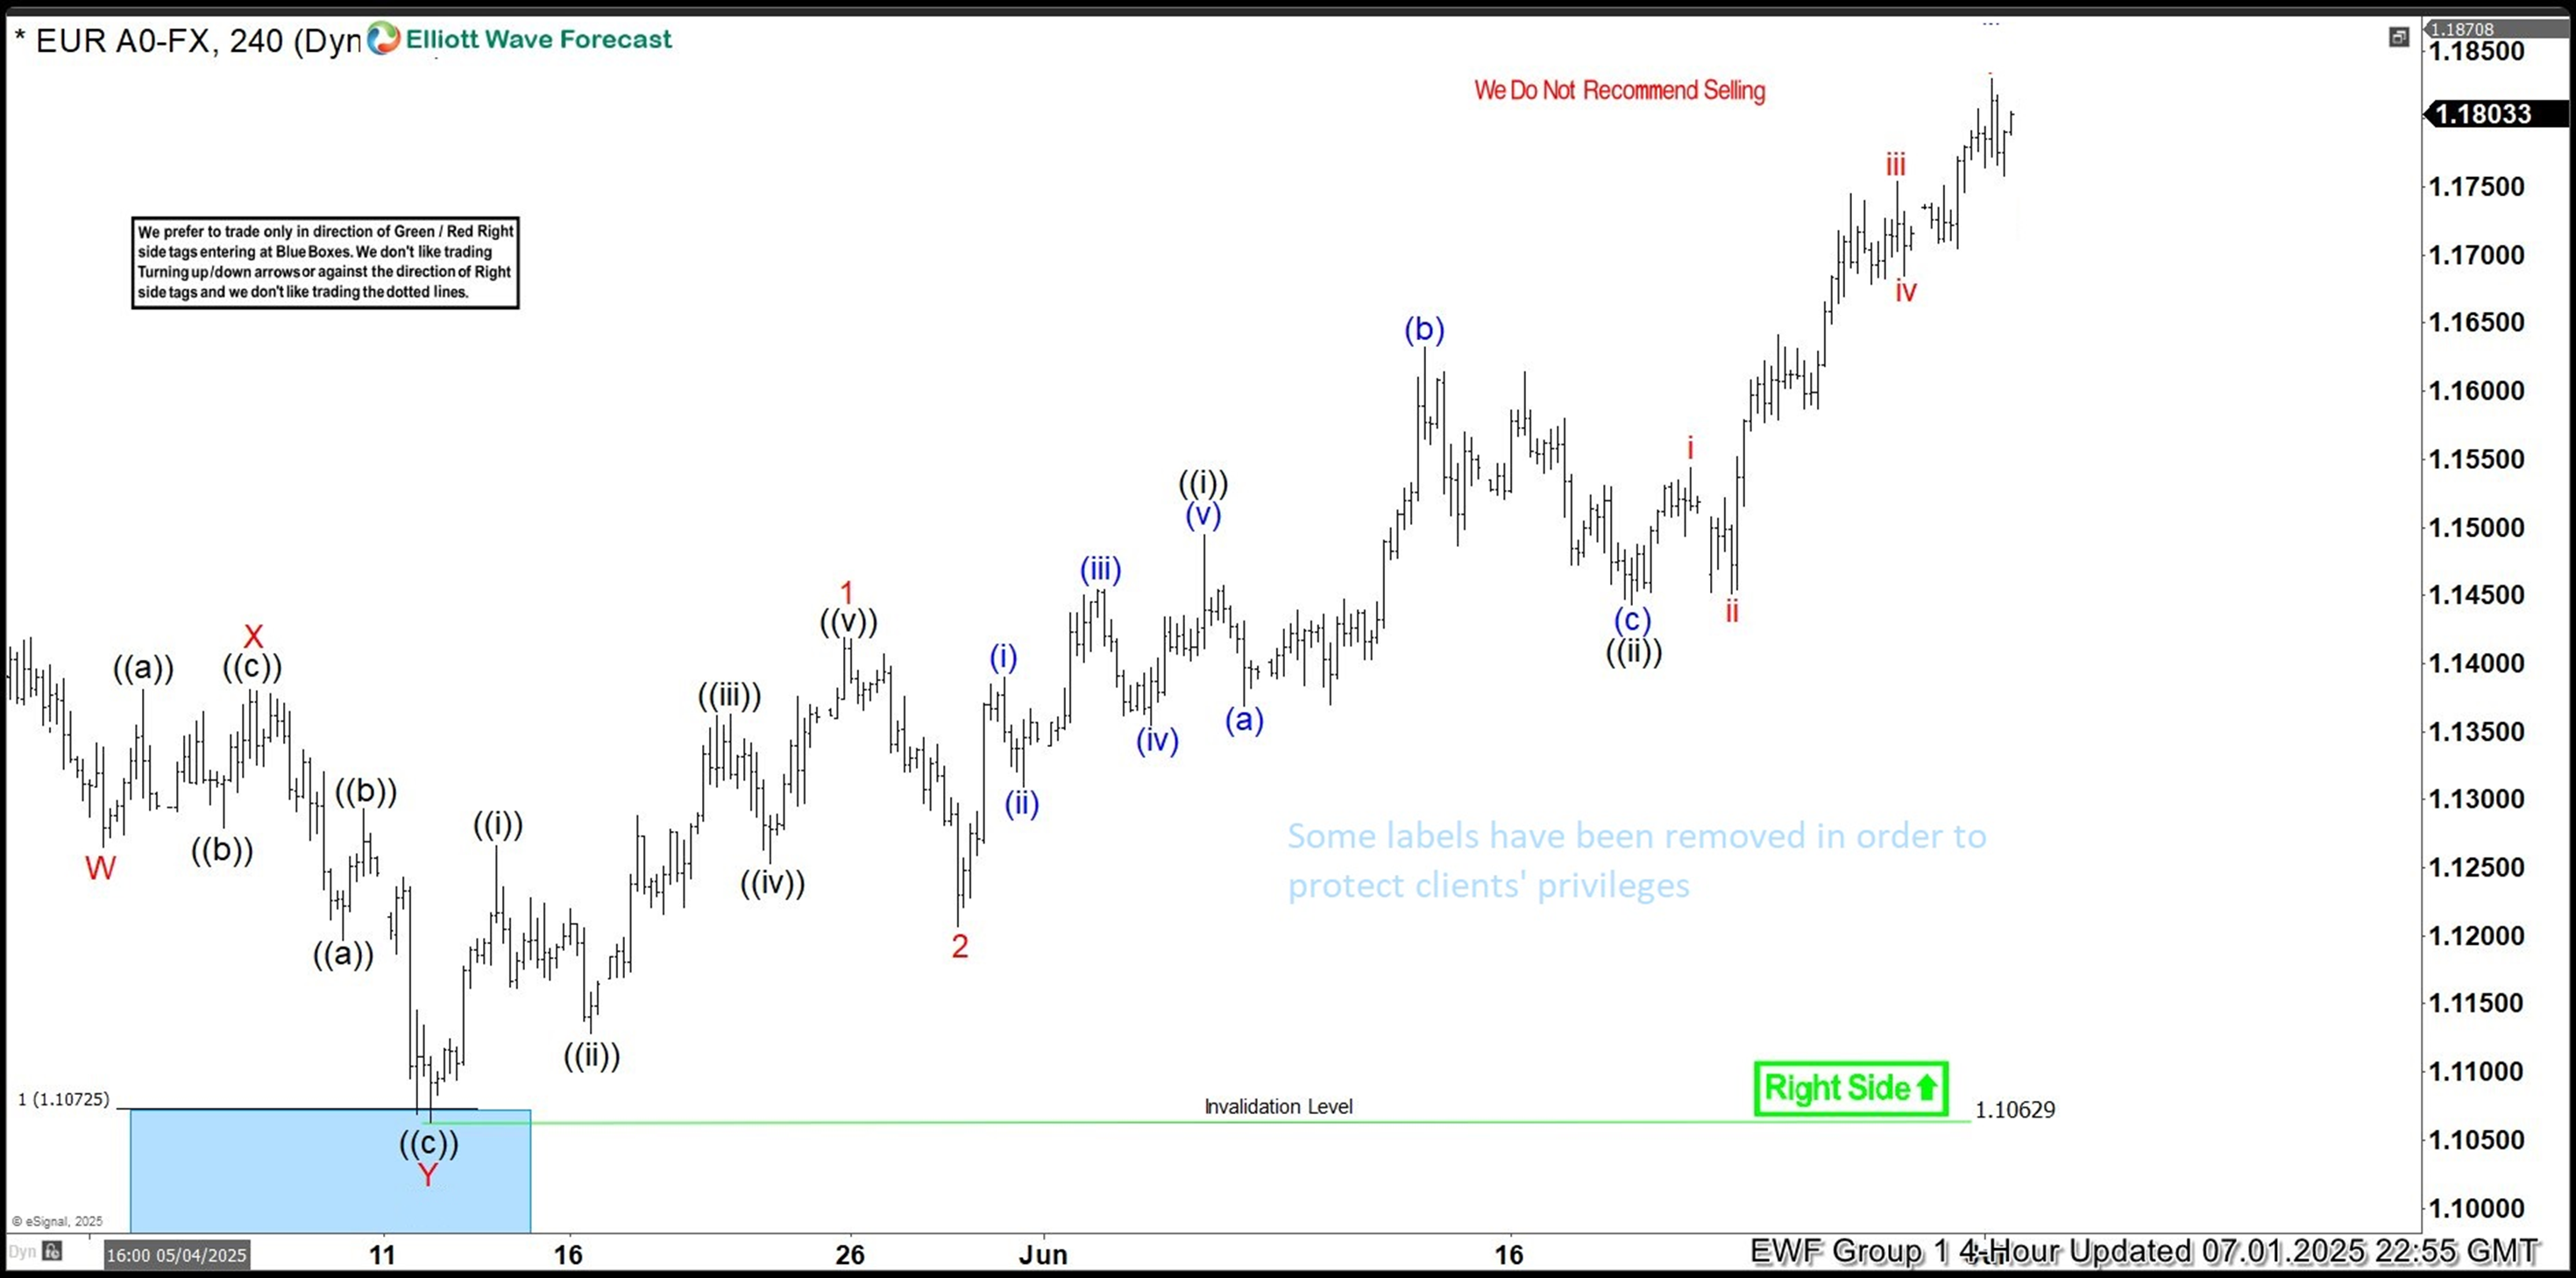
EUR/USD Elliott Wave four-hour chart 07.01.2025

Less than a 2 months later we are seeing great results. The pair has found buyers at the Blue Box, just as expected. The correction ended at the 1.10629 low, and since then, EURUSD is giving us a rally. As a result, all long positions entered at the Blue Box are now risk-free — we’ve moved our stop loss to breakeven and already secured partial profits.

Chart

Author

Elliott Wave Forecast Team

Elliott Wave Forecast Team

ElliottWave-Forecast.com

More from Elliott Wave Forecast Team
Share:

Editor's Picks

EUR/USD flirts with daily highs, retargets 1.1900

EUR/USD regains upside traction, returning to the 1.1880 zone and refocusing its attention to the key 1.1900 barrier. The pair’s slight gains comes against the backdrop of a humble decline in the US Dollar as investors continue to assess the latest US CPI readings and the potential Fed’s rate path.

GBP/USD remains well bid around 1.3650

GBP/USD maintains its upside momentum in place, hovering around daily highs near 1.3650 and setting aside part of the recent three-day drop. Cable’s improved sentiment comes on the back of the Greenback’s  irresolute price action, while recent hawkish comments from the BoE’s Pill also collaborate with the uptick.

Gold holds above $5,000 as bears seem hesitant amid Fed rate cut bets

Gold edges lower at the start of a new week, though it defends the $5,000 psychological mark through the Asian session. The underlying bullish sentiment is seen acting as a headwind for the bullion. However, bets for more rate cuts by the Fed, bolstered by Friday's softer US CPI, keep the US Dollar bulls on the defensive and continue to support the non-yielding yellow metal as the focus now shifts to FOMC Minutes on Wednesday.

Week ahead: Data blitz, Fed Minutes and RBNZ decision in the spotlight

The US jobs report for January, which was delayed slightly, didn’t do the dovish Fed bets any favours, as expectations of a soft print did not materialize, confounding the raft of weak job indicators seen in the prior week.

Global inflation watch: Signs of cooling services inflation

Realized inflation landed close to expectations in January, as negative base effects weighed on the annual rates. Remaining sticky inflation is largely explained by services, while tariff-driven goods inflation remains limited even in the US.

Ripple Price Forecast: XRP potential bottom could be in sight

Ripple edges up above the intraday low of $1.35 at the time of writing on Friday amid mixed price actions across the crypto market. The remittance token failed to hold support at $1.40 the previous day, reflecting risk-off sentiment amid a decline in retail and institutional sentiment.