EUR/USD, GBP/USD build opposite head and shoulders reversal patterns

EUR/USD
4 hour
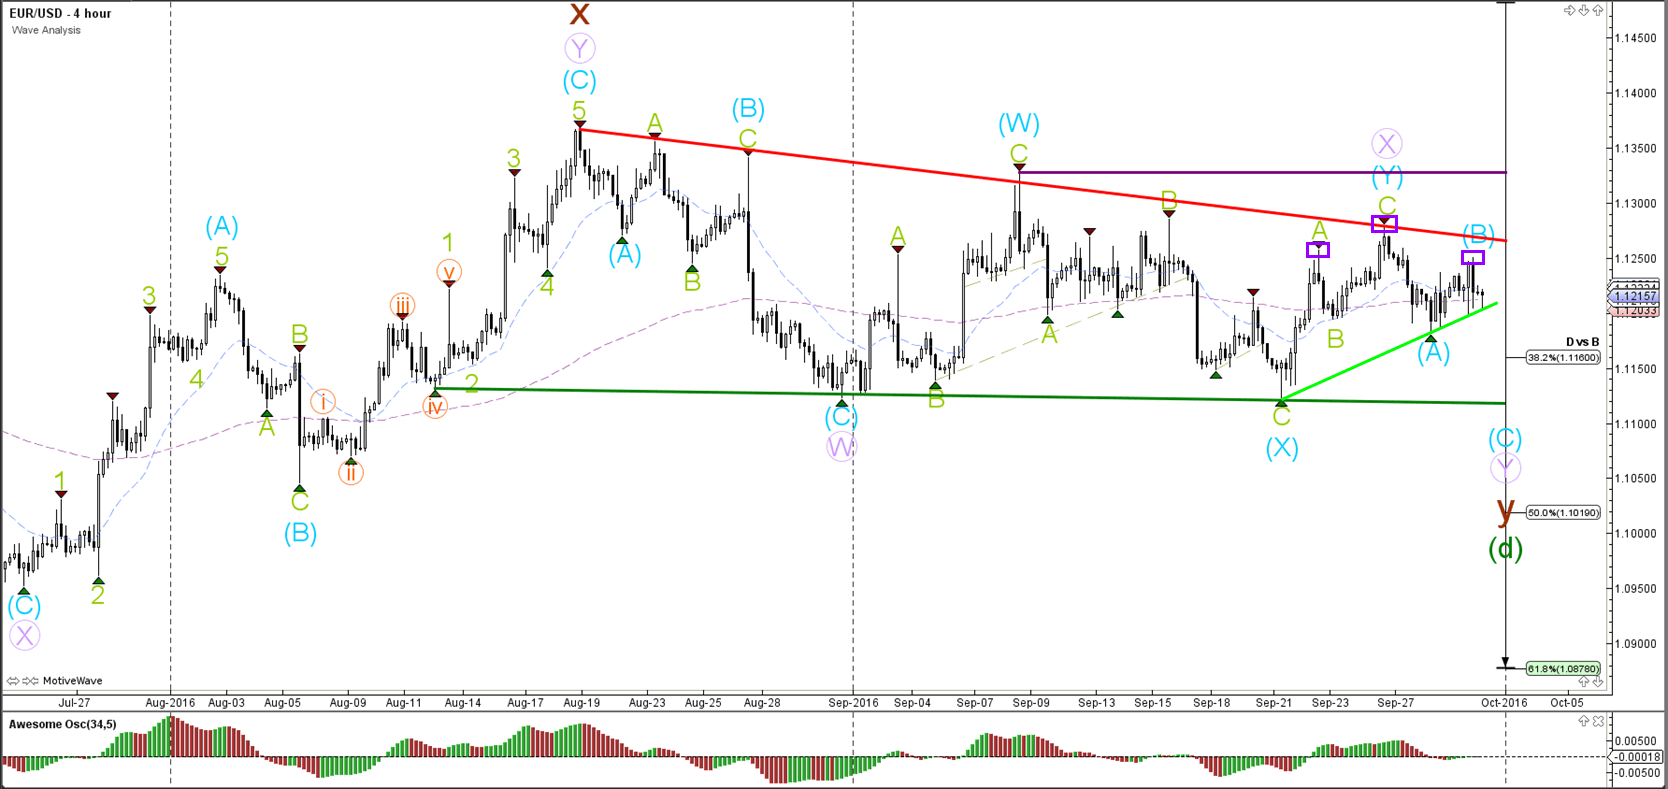
The EUR/USD continued with its bullish retracement yesterday but the resistance at 1.1250 has so far stopped price from moving higher. As expected in yesterday’s analysis, the head and shoulders pattern (purple boxes) is a reversal pattern that could indicate a bearish bounce if price manages to break the neck line (light green) of that pattern. Such a rejection could occur when a bearish ABC (blue) zigzag occurs that could bring price back towards the bottom of the larger consolidation zone (purple/green lines).
1 hour
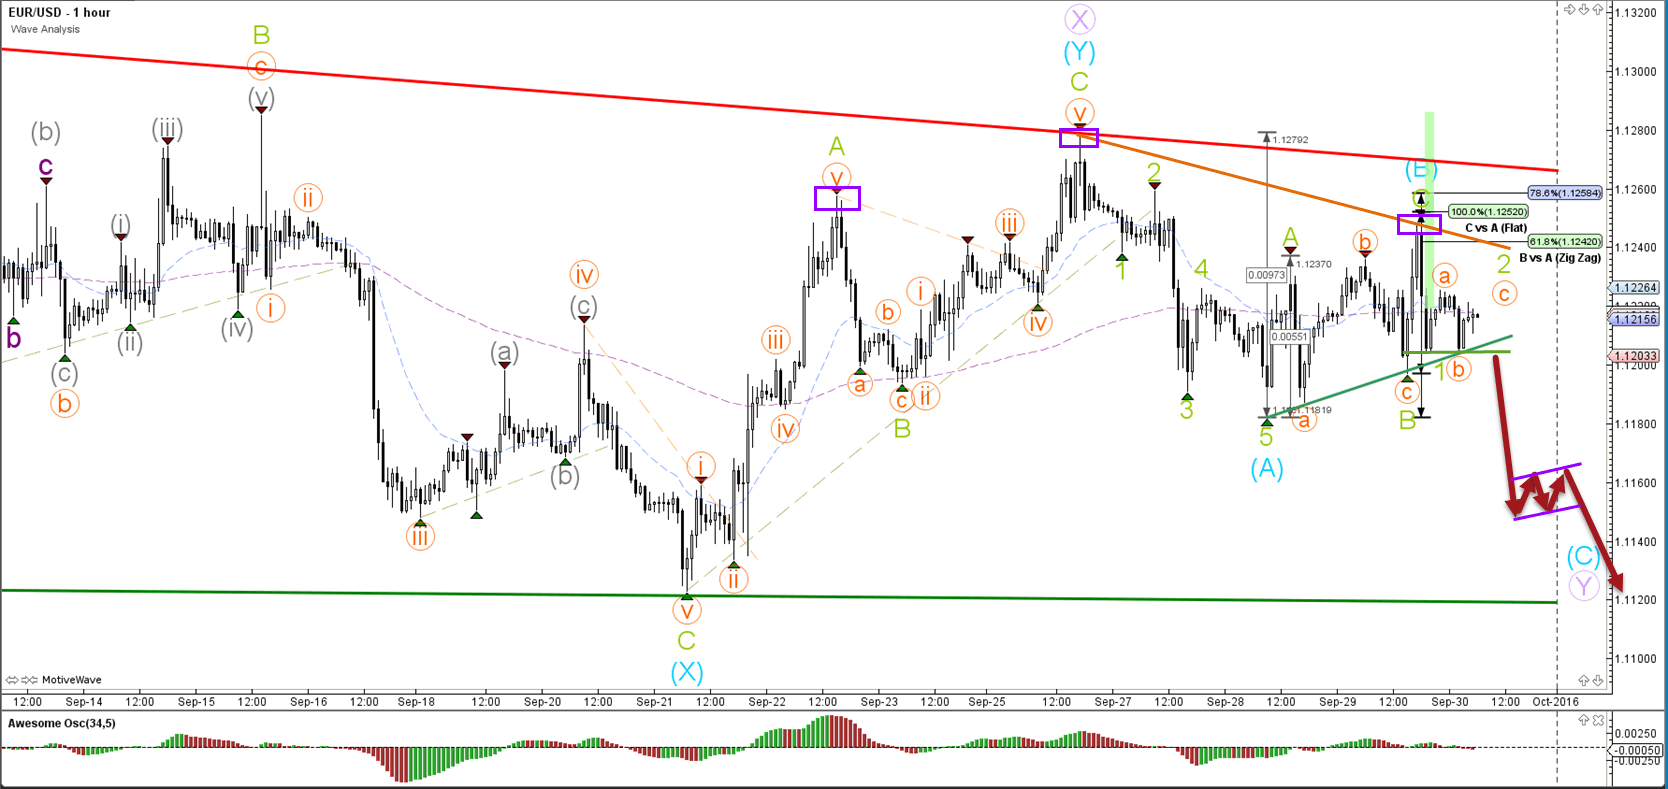
The EUR/USD seems to have completed a bullish ABC zigzag (green) within wave B (blue). A move higher would still resistance at trend lines (orange/red) and Fib levels but a break above that zone would invalidate the current ABC (blue). A break below support (light green) could see the potential start of bearish momentum (dark red arrows).
GBP/USD
4 hour
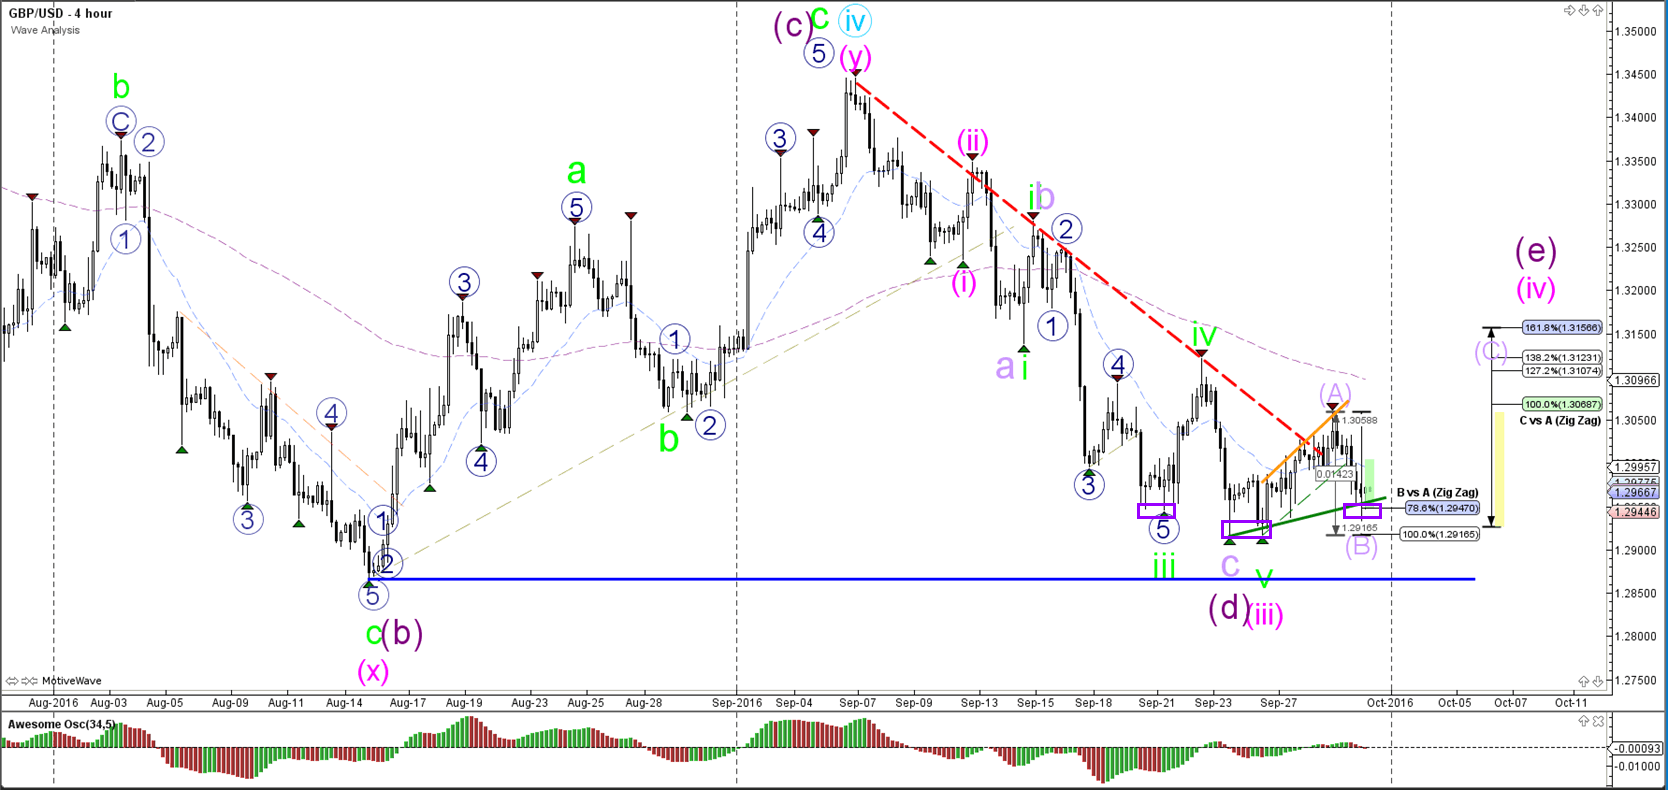
The GBP/USD bearish price action seems to move correctively, which makes a larger ABC (light purple) the most likely wave structure at the moment. Price has retested the previous bottom and is stopping at the 78.6% Fibonacci retracement of wave B (light purple), which is the level of a potential inverted head and shoulders (purples boxes) reversal pattern. Price could either be in a wave E (purple) or wave 4 (pink), which depends on whether price moves above the 100% Fibonacci level (wave E) or stays below it (wave 4).
1 hour
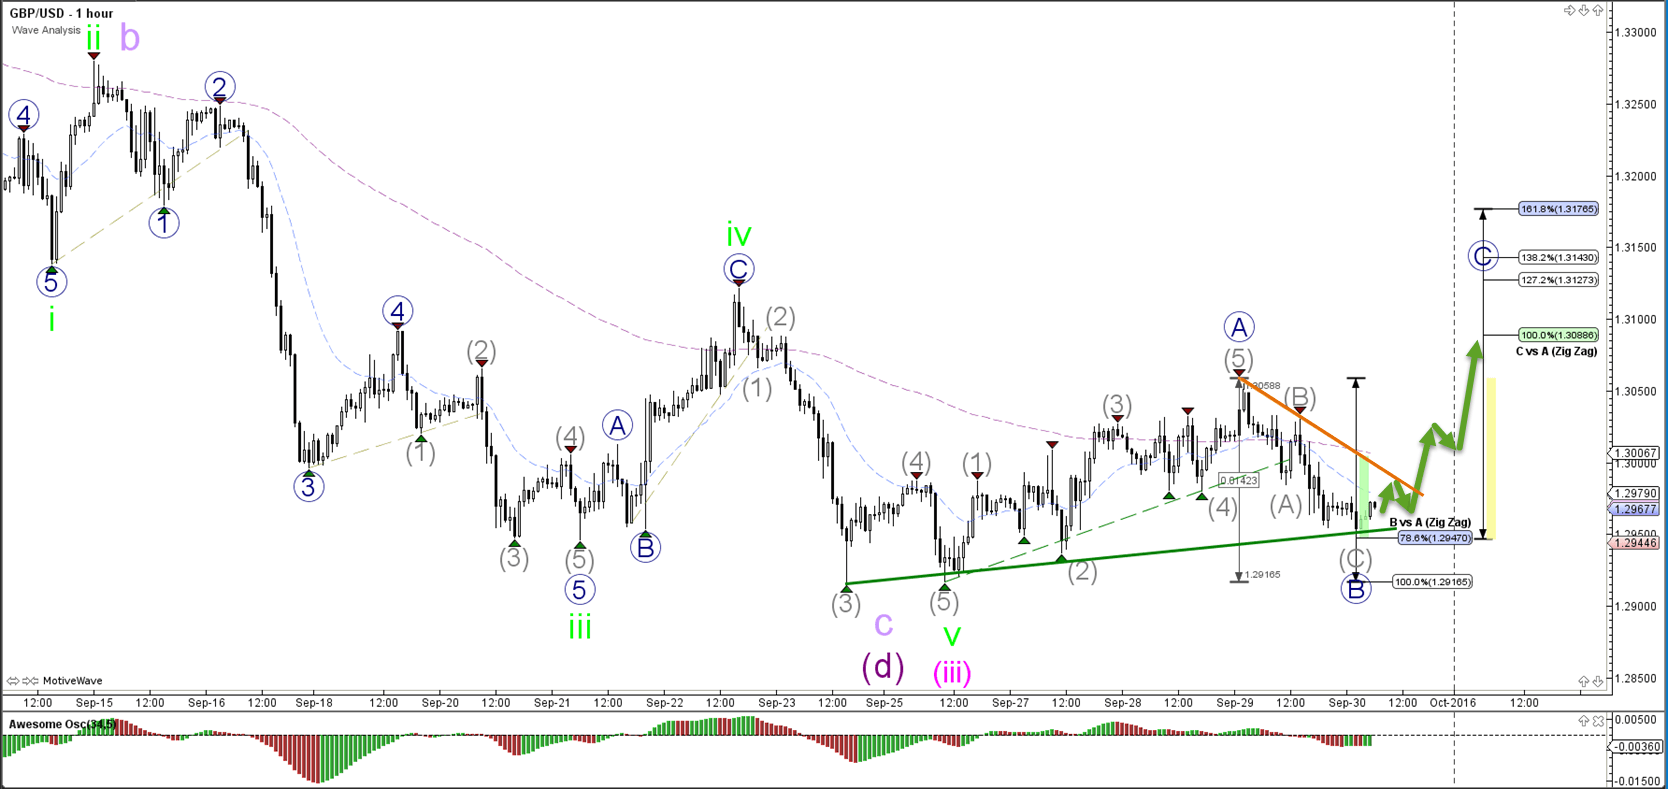
The GBP/USD break above resistance (orange) could see a bullish move higher but a break below the 100% Fibonacci invalidates the wave B (blue).
USD/JPY
4 hour
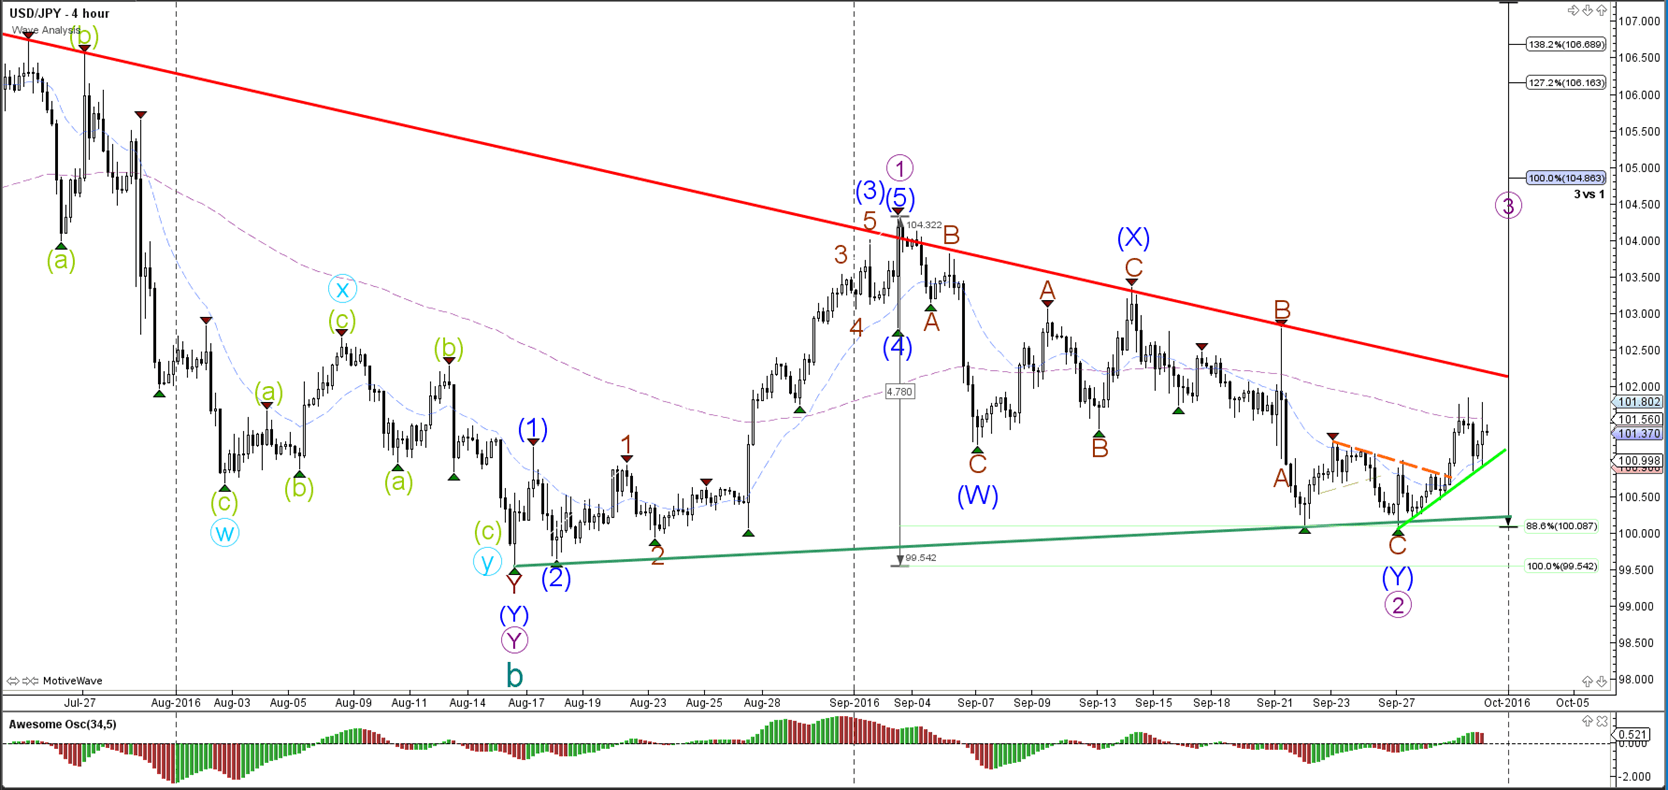
The USD/JPY remains stuck between the resistance of the daily downtrend channel (red) and the support of the various bottoms (green) and 88.6% Fibonacci level of wave 2 (purple). A break below the bottoms invalidates the bullish reversal, whereas a break above the bearish channel confirms the potential for a wave 3 (purple).
1 hour
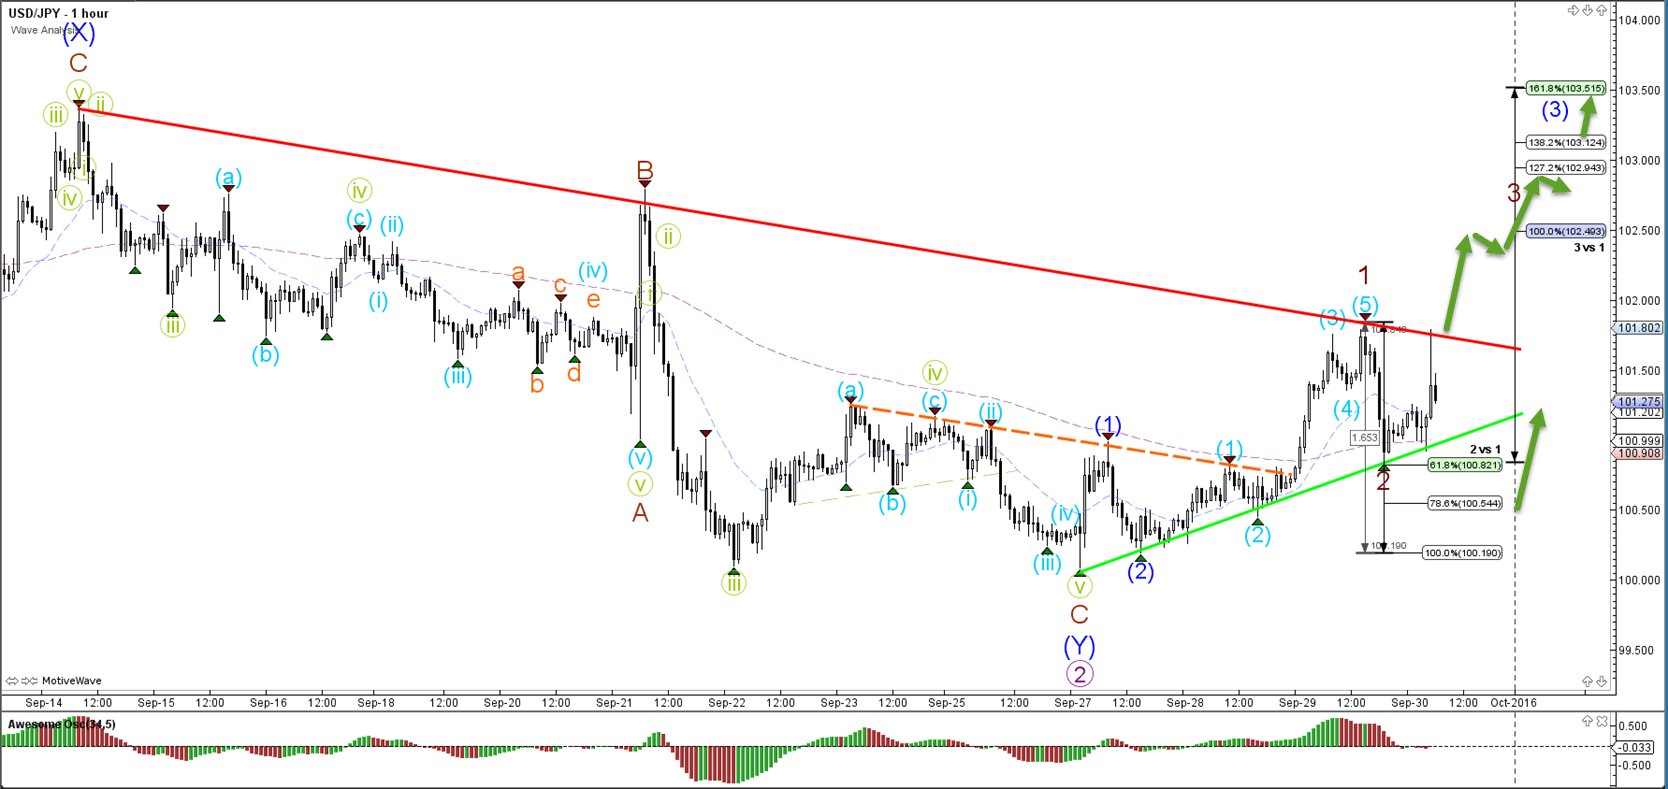
The USD/JPY potential break above the resistance (red) trend line could spark the start of a wave 3 (brown/blue) bullish momentum. A push lower could still see price bounce at the 78.6% Fibonacci retracement level but a break below the 100% Fib invalidates the wave 1-2 (brown).
Author

Chris Svorcik
Elite CurrenSea
Experience Chris Svorcik has co-founded Elite CurrenSea in 2014 together with Nenad Kerkez, aka Tarantula FX. Chris is a technical analyst, wave analyst, trader, writer, educator, webinar speaker, and seminar speaker of the financial markets.


