EUR/USD Forecast: Near-term sellers paused ahead of a critical support area

EUR/USD Current price: 1.0946
- Tepid growth-related figures from the EU and the US spurred concerns.
- The Federal Open Market Committee will release the Minutes of its latest meeting on Wednesday.
- EUR/USD could resume its decline of an acceleration through the 1.0920 price zone.
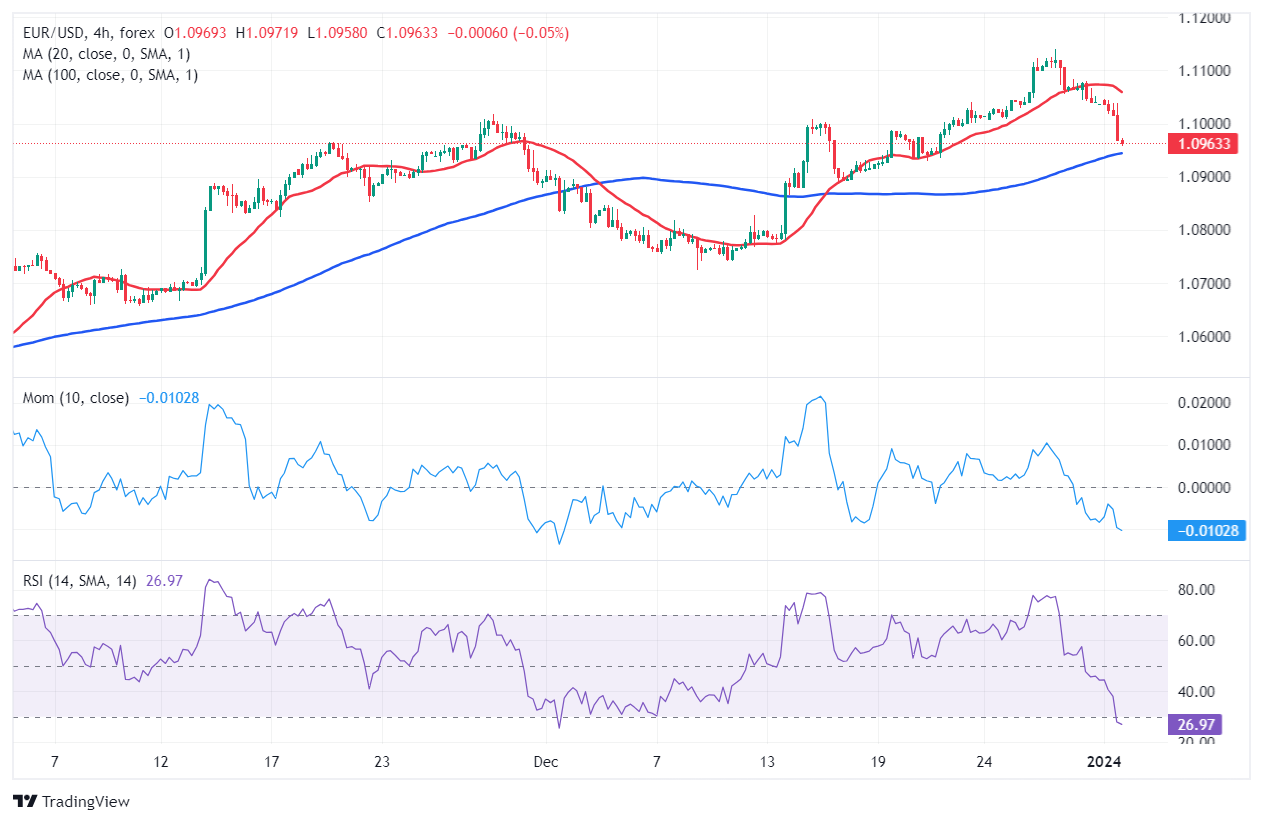
The EUR/USD pair edged sharply lower on Tuesday, bottoming at 1.0940 and holding nearby ahead of Wall Street’s close. The pair shed roughly 90 pips on the first trading day of 2024, as the US Dollar benefited from a souring market mood, as macroeconomic data indicated economic contraction persisted at the end of 2023.
S&P Global released the December Manufacturing PMIs for the Eurozone and the United States (US), with the EU index reported at 44.4, slightly better than the previous 44.2. The US index, however, came in at 47.9, contracting from the previous 48.2. Stocks edged lower, while Treasury yields ticked north, in line with the risk-averse sentiment.
The macroeconomic calendar will be packed with relevant data, starting on Wednesday with the release of the December US ISM Manufacturing PMI and the Federal Open Market Committee (FOMC) Meeting Minutes. Since Chairman Jerome Powell said rate cuts analysis is around the corner, it would be interesting to check whether policymakers officially discussed it.
EUR/USD short-term technical outlook
The EUR/USD pair heads into the daily close hovering around the 1.0950 level, in the red for a third consecutive day. Technical readings in the daily chart suggest the decline may continue, particularly if the pair breaks through the 1.0920 price zone, where it has a bullish 20 SMA (Simple Moving Average), which advances well above the longer ones. Technical indicators, in the meantime, gyrated south and corrected overbought conditions, but remain within positive levels falling short of confirming a continued slump.
The 4-hour chart shows the decline may have come to an end. Technical indicators are bouncing with uneven strength from oversold levels, while the intraday slide met buyers around a still bullish 100 Simple Moving Average (SMA). The 20 SMA, in the meantime, gained downward traction above the current level, suggesting buyers remain sidelined. A steeper decline could be expected on a slide through the 1.0920 area, with market players looking then for a test of the 1.0840/50 price zone.
Support levels: 1.0925 1.0880 1.0845
Resistance levels: 1.0990 1.1015 1.1050
Author

Valeria Bednarik
FXStreet
Valeria Bednarik was born and lives in Buenos Aires, Argentina. Her passion for math and numbers pushed her into studying economics in her younger years.