EUR/USD Forecast: Modest bounce on a slightly better mood

EUR/USD Current Price: 1.0876
- In the absence of relevant data, market’s attention remains on the US debt ceiling.
- US Federal Reserve officials will hit the wires in the American afternoon.
- EUR/USD is in a corrective advance, bears lead as long as it remains below 1.0900.
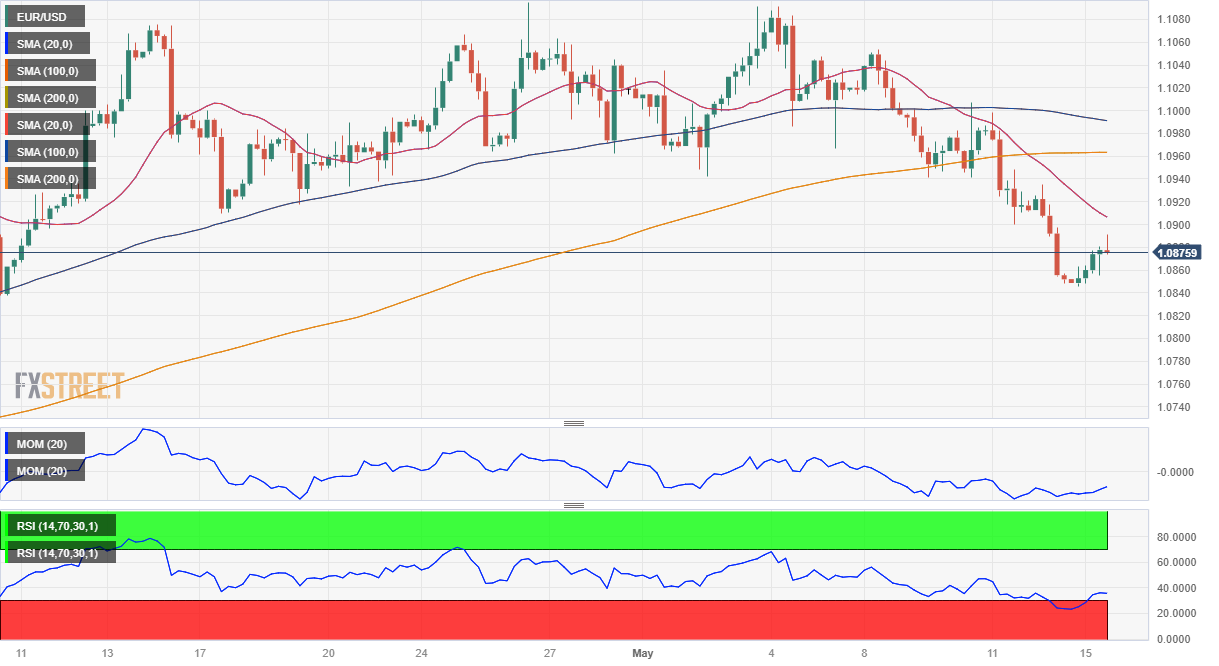
The EUR/USD pair recovers some of the ground lost last week, trading around 1.0875 ahead of the United States (US) opening. The US Dollar rallied on Friday, pushing the pair to a one-month low of 1.0847, led by a risk-off mood. In the absence of first-tier data, financial markets are focused on the US debt ceiling and the battle among lawmakers to extend it and dodge a default. President Joe Biden announced this Monday that he will meet Congressional leaders on Tuesday to continue negotiations.
On the data front, the Eurozone published March Industrial Production, which fell by more than anticipated, declining 4.1% MoM and 1.4% YoY. The May US NY Empire State Manufacturing Index printed at -31.8, much worse than the previous 10.8 and the expected -2.5. Later in the day, several Federal Reserve (Fed) speakers will be on the wires during the American session, although surprises are not expected from that side.
The market mood at the beginning of the new week is in better shape, although caution persists. European and Asian indexes stay in the green, underpinning Wall Street’s futures and weighing on the USD. At the same time, government bond yields picked up. The 10-year Treasury note currently yields 3.50%, while the 2-year note offers 4.02%.
EUR/USD short-term technical outlook
The daily chart for the EUR/USD pair shows it remains at the lower end of Friday’s range and that it is having a hard time picking up. EUR/USD trades well below a bearish 20 Simple Moving Average (SMA), providing dynamic resistance at around 1.0980. At the same time, the longer moving averages keep advancing below the current level, although at a slower pace. Furthermore, the 100 SMA stands at 1.0800, reinforcing the psychological support level. Finally, technical indicators have turned higher, but without enough strength to support another leg higher while holding well into negative territory.
In the near term, and according to the 4-hour chart, the bounce from the recent low seems corrective. Technical indicators corrected extreme oversold conditions and maintain upward slopes but far below their midlines. Additionally, the pair develops far below all its moving averages, with the 20 SMA heading firmly south well below the longer ones. Sellers will likely appear around the 1.0900 figure, while the case for a steeper decline will be stronger on a break below 1.0745, the 61.8% retracement of the 2022 yearly decline.
Support levels: 1.0830 1.0785 1.0745
Resistance levels: 1.0895 1.0940 1.0985
Author

Valeria Bednarik
FXStreet
Valeria Bednarik was born and lives in Buenos Aires, Argentina. Her passion for math and numbers pushed her into studying economics in her younger years.

















