EUR/USD Forecast: Market fears favor a bearish breakout

EUR/USD Current Price: 1.0620
- Market participants kick-started the week with caution ahead of critical inflation figures.
- The German IFO Survey indicated a better-than-anticipated Business Climate in September.
- EUR/USD nears September low, with bears looking to take it below 1.0600.
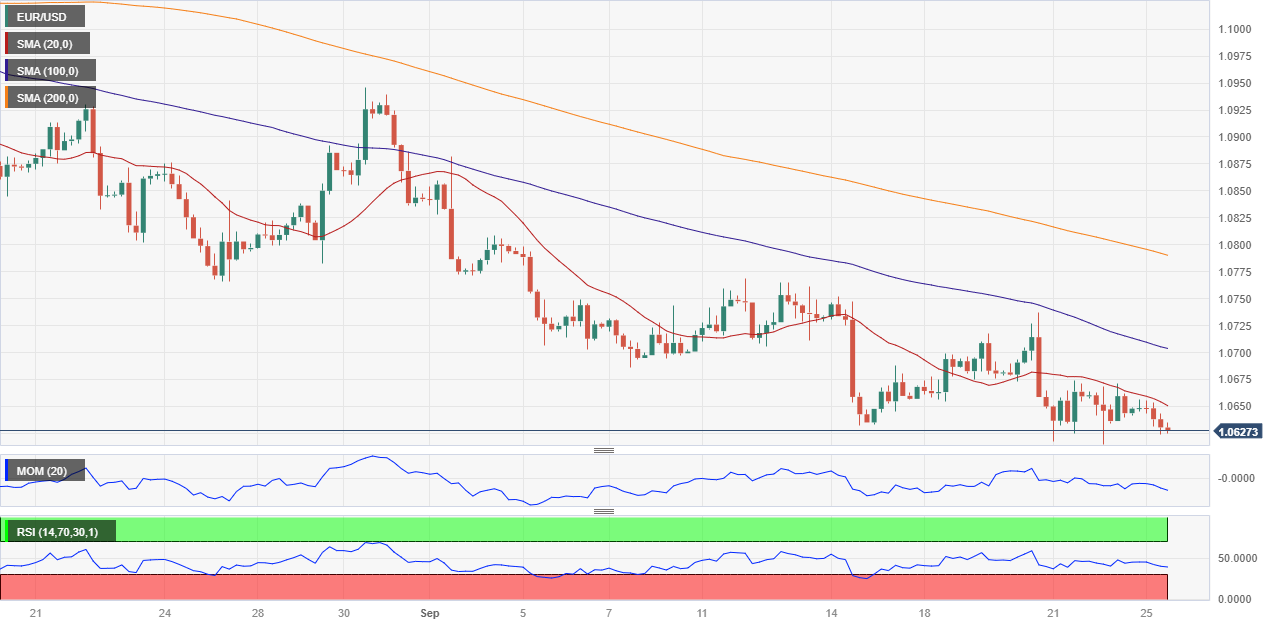
The US Dollar started the week with a firm footing, resulting in EUR/USD trading as low as 1.0619. Following central banks' mostly hawkish decisions last week, investors are concerned that persistently tight financial conditions will harm economic developments for longer than anticipated. Despite most central banks having lately decided to pause their aggressive tightening policies, policymakers pledged for "higher for longer," with rate cuts out of the table, at least for the first half of 2024.
Meanwhile, the Euro temporarily benefited from a better-than-anticipated German IFO survey. The Business Climate printed in September to 85.7, better than the 85.2 forecast. Expectations improved from 82.6 to 82.9, while the assessment of the current situation contracted modestly, resulting in 88.7 from 89 in August. European Central Bank (ECB) President Christine Lagarde will speak at the top of the hour, testifying before the Committee on Economic and Monetary Affairs in Brussels.
The United States (US) released the Chicago Fed National Activity Index, which posted -0.16 in August, below a downwardly revised 0.07 in July. The country will later publish the September Dallas Fed Manufacturing Business Index.
Still, this week's focus will be on inflation after August's discouraging readings. Germany and the Euro Zone will unveil the preliminary estimates of the September Harmonized Index of Consumer Prices (HICP) on Thursday and Friday, respectively. By the end of the week, the US will release the August Personal Consumption Expenditures (PCE) - Price Index, foreseen up by 0.5% MoM, much higher than the previous 0.2%.
EUR/USD short-term technical outlook
The EUR/USD pair trades a handful of pips above the intraday low, with its bearish bias intact. The daily chart shows that the pair is not too far from the multi-month low posted last week at 1.0614 while it develops below all its moving averages. The 20 Simple Moving Average (SMA) maintains its bearish slope well below the longer ones and over 100 pips above the current level. The Relative Strength Index (RSI) indicator extended its downward slope within negative levels, reflecting sellers' strength. The Momentum indicator, however, advances below its 100 line, as the pair would need to slip below 1.0610 for a firmer bearish case.
The risk skews to the downside in the near term, according to the 4-hour chart. The 20 SMA gains downward traction above the current level while below the longer ones, in line with persistent US Dollar demand. Finally, technical indicators are neutral-to-bearish below their midlines, reflecting the absence of buying interest.
Support levels: 1.0610 1.0580 1.0540
Resistance levels: 1.0675 1.0720 1.0765
Author

Valeria Bednarik
FXStreet
Valeria Bednarik was born and lives in Buenos Aires, Argentina. Her passion for math and numbers pushed her into studying economics in her younger years.
















