WTI holds support after Trump’s ceasefire claim

They say that beauty is in the eye of the beholder. But it appears the principle extends to “truth” as well.
Because that’s exactly what has happened for the oil markets over the last 24 hours, with Trump’s “Truth nuke” on Truth social, claiming that a ceasefire between Russia and Ukraine is immediate.
WTI fell 1.42% to $90.55 a barrel in an early Monday snapshot, as traders weighed the prospect of fewer attacks on Russian refineries and more diesel reaching the market. A lovely idea.
There was just one problem: neither side had confirmed the deal.
Zelenskyy said the announcement had caught him by surprise. He also reported Russian strikes on power facilities in Kyiv and Kharkiv after Trump’s post. Moscow had not publicly agreed to a ceasefire, while Ukraine said it would stop attacking Russian energy sites if Russia did the same.
So oil got its peace dividend before anyone had delivered the peace. And the market has spent the rest of the session reconsidering that bargain.
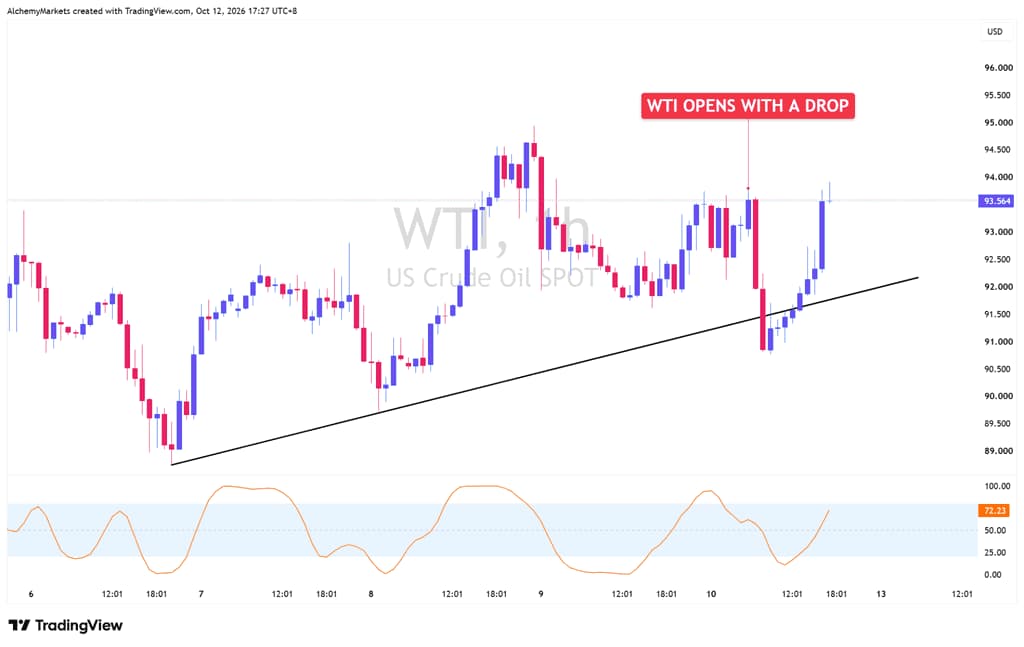
WTI daily: 90-92 is still doing its job
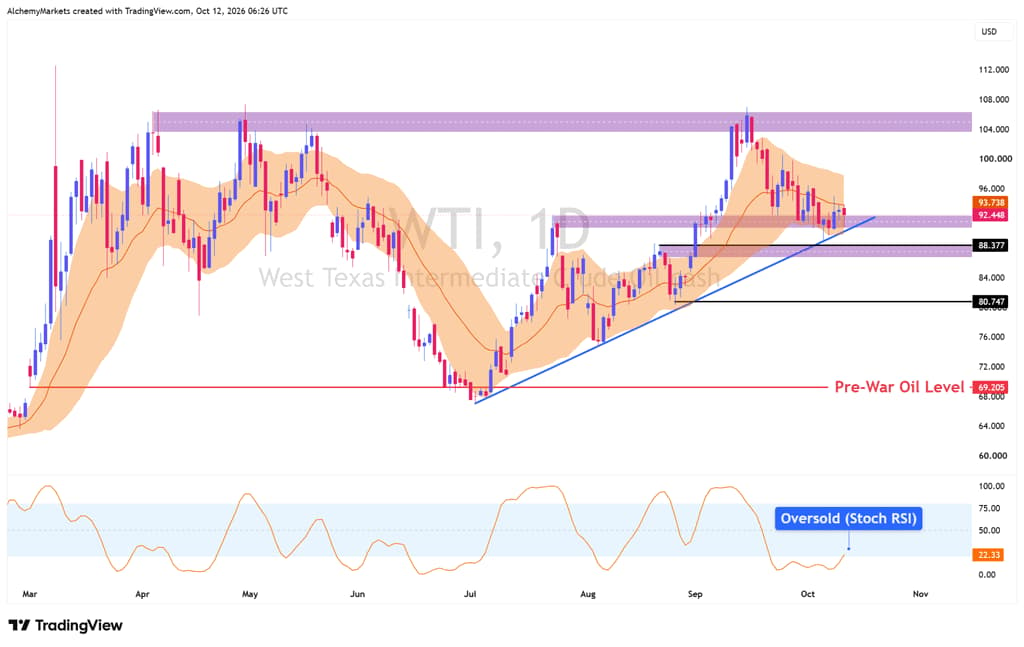
Zoom out and the bigger picture is more encouraging for oil bulls. The 90-92 area is an old breakout zone, and the rising blue trendline connecting the July and August lows is now acting as reinforced technical support.
The daily 20-EMA bollinger band, set one standard deviation either side, has not given way decisively to the downside. And the last break was still to the upside, which means the uptrend is technically intact.
Stochastic RSI is near oversold on this earlier daily snapshot. For me, that keeps the recovery case alive, provided buyers defend the support rather than simply bouncing once and disappearing.
WTI four-hour: The awkward part is still above
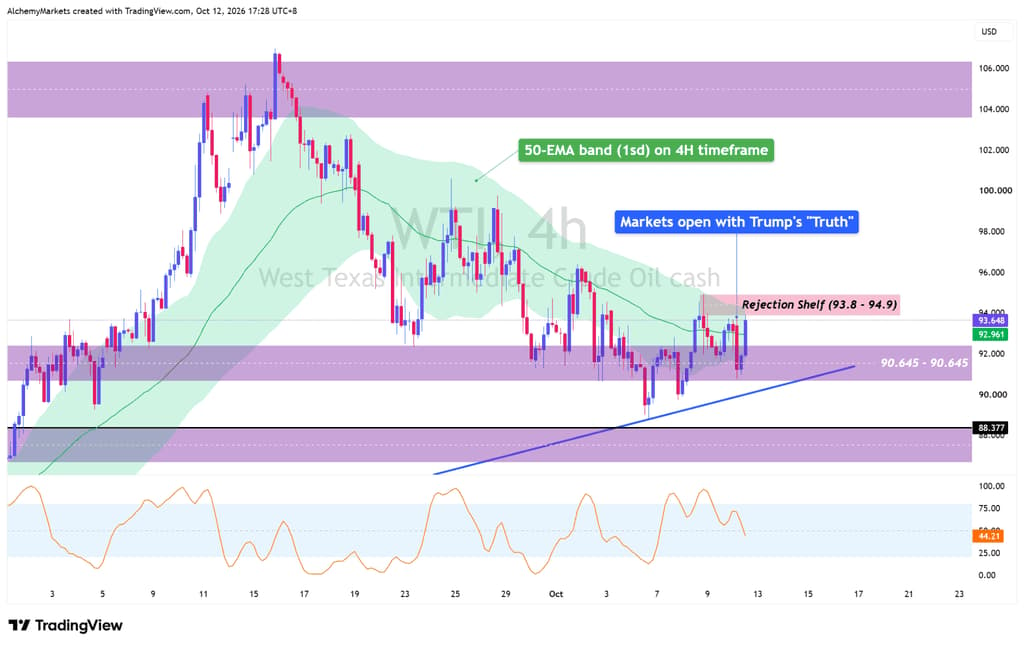
The 4H chart is where the bulls have some work to do.
Notice how WTI has consistently been suppressed by the green band (4H-50 EMA band, 1sd). Until this band is broken to the upside, I’d expect the same behaviour to occur.
We’re currently testing the shelf between $93.80 and $94.90 as an overhead resistance. If cleared, it could act as a confirmation for the broader uptrend signal on the daily timeframe.
Until then, WTI could actually still be rejected and coil up within a tight range between 90.6 to 94.9.
Lose the 90-92 support area and the rising trendline, however, and I would look towards the next marked support near $88.38. That would put the daily recovery view under real pressure.
The Oil market has other problems
Trump’s separate Russian diesel proposal could help ease a fuel shortage if barrels are produced, approved, shipped and delivered.
But markets need to see actual proof in oil and diesel flow changes, which cannot simply be done by an unsubstantiated social media post.
Refineries damaged by attacks do not magically repair themselves because someone announces a truce.
There are other supply headaches too. About 57.5% of US Gulf offshore oil output was still shut in on Sunday after Hurricane Isaias, even though production was gradually recovering.
Washington has authorised an emergency Strategic Petroleum Reserve exchange of up to four million barrels, but authorisation is not delivery.
The Middle East is hardly quiet either. Attacks around Riyadh and tanker incidents near the Strait of Hormuz continue to threaten oil and fuel transport.
Three questions for the week
Does falling Oil mean US inflation is finally cooling?
It helps if lower prices last. But Wednesday’s US CPI and Thursday’s PPI, both due at 8:30 a.m. ET, will tell us more about the inflation picture. The US 10-year Treasury yield stood at 5.24% on Friday, and Monday’s bond-market holiday limits any fresh rates confirmation.
Why can diesel stay expensive when crude falls?
Diesel needs working refineries, power and transport. More crude on paper does not immediately create more fuel at the pump. If diesel prices and shipping costs stay high, crude could find support even without a fresh geopolitical headline.
Does this give stocks, AI and gold the green light?
Not quite. Nasdaq futures rose about 0.5% in Monday’s early snapshot as oil eased, but high yields and costly AI financing still put pressure on valuations. Gold has its own tug-of-war between safe-haven demand, the dollar and real yields. I would want broader market confirmation before calling this a lasting risk-on turn.
Author

Zorrays Junaid
Alchemy Markets
Zorrays Junaid has extensive combined experience in the financial markets as a portfolio manager and trading coach. More recently, he is an Analyst with Alchemy Markets, and has contributed to DailyFX and Elliott Wave Forecast in the past.
















