EUR/USD Forecast: Euro looks to test parity as markets remain risk-averse
- EUR/USD has extended its slide toward parity early Monday.
- Nord Stream 1 pipeline will go into unscheduled maintenance at the end of the month.
- Wall Street's main indexes remain on track to open sharply lower.
EUR/USD has started the new week under bearish pressure and continued to push lower toward parity. In the absence of high-impact macroeconomic data releases, the risk perception could drive the pair's action for the remainder of the day.
Late Friday, Russia's Gazprom announced that the Nord Stream 1 pipeline will go into unscheduled maintenance at the end of August and gas flows to Europe will be halted for three days. Once the maintenance is completed, the capacity is expected to recover to 20% of the total capacity.
Meanwhile, European Central Bank (ECB) policymaker and Bundesbank President Joachim Nagel said earlier in the day the ECB must keep hiking the policy rate while acknowledging that the German economy is likely to tip into recession over the winter. These comments, however, did little to nothing to help the shared currency find demand.
In the second half of the day, the Federal Reserve Bank of Chicago's National Activity Index will be the only featured in the US economic docket.
Investors will keep a close eye on the market mood as well. In the early European morning, US stock index futures are down between 0.75% and 1.1%, suggesting risk flows are likely to dominate the markets in the American session. Unless there's an improvement in risk sentiment, the greenback should be able to continue to outperform its risk-sensitive rivals.
EUR/USD Technical Analysis
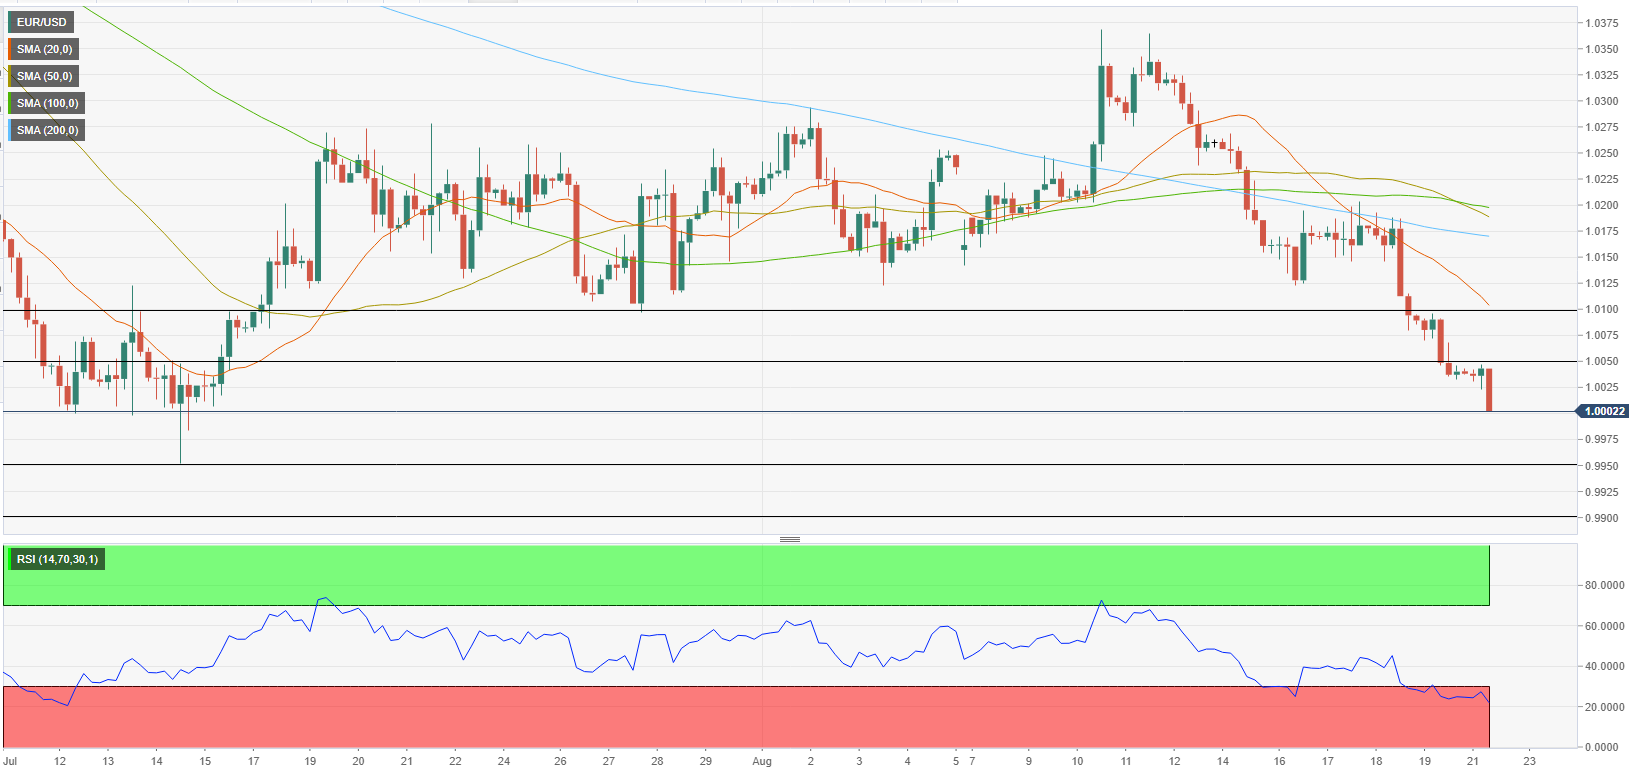
EUR/USD was last seen trading within a touching distance of the all-important parity level. In case this support fails, the next bearish target could be seen at 0.9950 (multi-year low set on July 14) and 0.9900 (psychological level).
On the upside, 1.0050 (static level) aligns as initial resistance before 1.0100 (static level, psychological level, 20-period SMA on the four-hour chart and 1.0170 (200-period SMA).
It's worth noting that the Relative Strength Index (RSI) indicator on the four-hour chart stays well below 30, suggesting that the pair could stage a technical correction before the next leg lower.
Premium
You have reached your limit of 3 free articles for this month.
Start your subscription and get access to all our original articles.
Author

Eren Sengezer
FXStreet
As an economist at heart, Eren Sengezer specializes in the assessment of the short-term and long-term impacts of macroeconomic data, central bank policies and political developments on financial assets.


