EUR/USD Forecast: Euro could extend recovery with a daily close above 1.1670/80
- EUR/USD has been moving in an ascending channel since the beginning of the week.
- Broad-based selling pressure surrounding the dollar helps EUR/USD push higher.
- Additional gains are likely if EUR/USD manages to clear 1.1670 resistance.
The EUR/USD pair has preserved its bullish momentum and registered its highest daily close since late September at 1.1650 on Wednesday supported by the unabated USD weakness. However, it is still too early to say that the recent advance is the beginning of a reversal rather than a correction as investors are unlikely to ignore the European Central Bank's (ECB) dovish policy outlook for long. For now, technical levels could determine the pair's near-term direction.
On Wednesday, Jens Weidmann, European Central Bank (ECB) Governing Council member and Bundesbank President, announced that he will be resigning from his position at the end of the year.
Weidmann was a known hawk as well as a loud critique of the ECB's ultra-loose monetary policy and his exit means that the bank will not face strong opposition if it continues to downplay inflation concerns in the euro area. Furthermore, ECB Governing Council member Francois Villeroy de Galhau reiterated that the ECB could afford to stay patient as the inflation spike is expected to remain temporary.
In the meantime, the greenback stays on the back foot as the Wall Street rally allows risk flows to continue to dominate the financial markets.
Later in the session, the weekly Initial Jobless Claims, October Philadelphia Fed Manufacturing Survey and September Existing Home Sales will be featured in the US economic docket. On the other hand, the European Commission will release the preliminary Consumer Confidence data for the euro area at 1400 GMT.
In case US stocks reverse direction and the benchmark 10-year US Treasury bond yield manages to hold near multi-month highs, EUR/USD could struggle to attract buyers. On the flip side, a technical breakout could allow the bullish bias to remain intact ahead of the weekend.
EUR/USD technical analysis
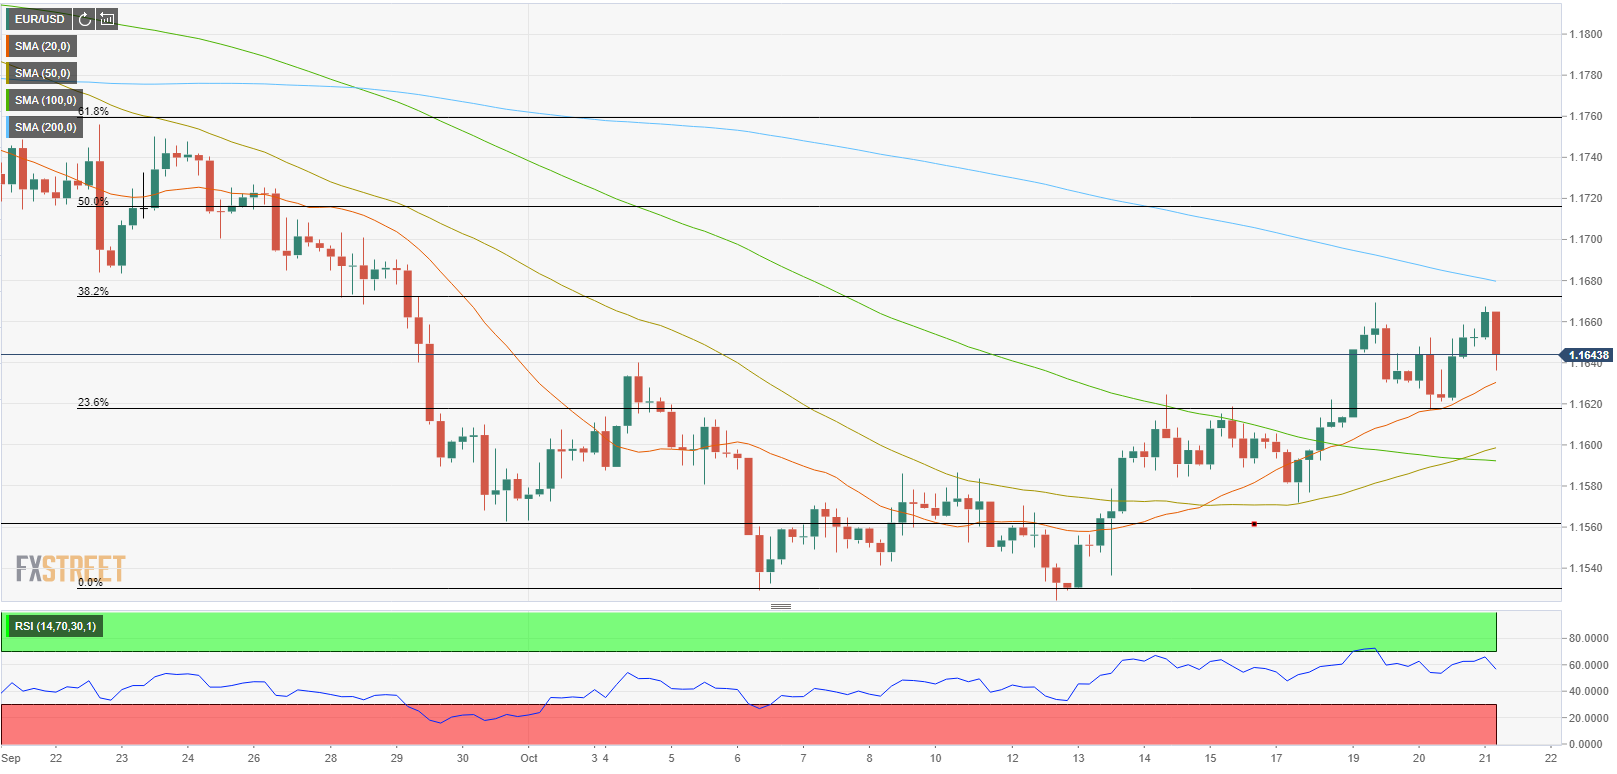
For the second time this week, EUR/USD lost its traction after closing in on 1.1670/80 area, where the Fibonacci 38.2 retracement of the September downtrend and the 200-period SMA on the four-hour chart align. A daily close above that resistance area could be seen as a bullish development and open the door for additional gains toward 1.1700 (psychological level) and 1.1720 (Fibonacci 50% retracement).
On the downside, the initial support is located at 1.1630/20 (20-period SMA, Fibonacci 23.6% retracement) before 1.1600 (psychological level, 100-period SMA, 50 period SMA) and 1.1560 (static level).
Premium
You have reached your limit of 3 free articles for this month.
Start your subscription and get access to all our original articles.
Author

Eren Sengezer
FXStreet
As an economist at heart, Eren Sengezer specializes in the assessment of the short-term and long-term impacts of macroeconomic data, central bank policies and political developments on financial assets.


