EUR/USD Forecast: Corrective decline underway

EUR/USD Current Price: 1.1182
- Chinese headlines flooded news feeds and dented the market mood.
- Softer-than-expected earnings reports put a halt to Wall Street’s rally.
- EUR/USD gains bearish momentum and aims to test a critical support level at 1.1105.
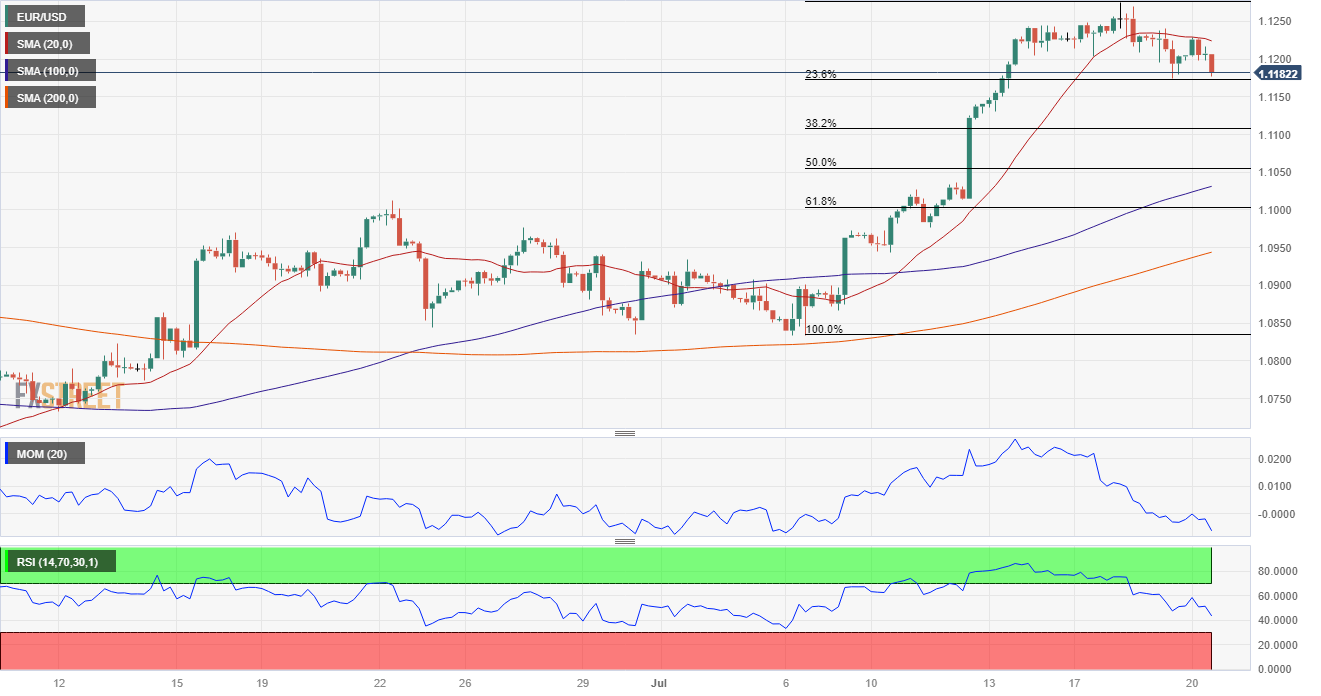
The EUR/USD pair recovered the 1.1200 threshold at the beginning of the day, but a worsening market mood limited the advance. The pair topped at 1.1228, easing afterwards to the current 1.1180 region.
Tensions between China and the United States (US) over curbs on the Asian giant chip sector and discouraging earnings reports from companies like Netflix and Tesla weighed on the mood during Asian trading hours. Following a positive close, US indexes lost momentum, with Wall Street’s futures trading in the red ahead of the opening.
At the same time, Chinese headlines flooded news feeds, although most were just rumours. Reports indicated that major local banks were seen selling dollars to slow the yuan’s decline and that authorities are considering easing mortgages to help the troubled housing sector. Additionally, China increased the macro-prudential adjustment parameter for cross-border financing of corporate and financial institutions to 1.5 from 1.25, aiming to boost confidence in the renminbi.
Mid-European morning, Germany released the June Producer Price Index (PPI), which rose by 0.1% YoY, slightly above the market expectation of a flat reading. The Eurozone reported the May Current Account seasonally adjusted at €9.1 billion. Finally, the US published Initial Jobless Claims for the week ended July 14, which printed at 228K, beating expectations. At the same time, the July Philadelphia Fed Manufacturing Survey posted -13.5, worse than the -10 anticipated by market participants. Later in the day, the US will publish June Existing Home Sales, while the EU will unveil the preliminary estimate of July Consumer Confidence.
EUR/USD short-term technical outlook
The daily chart for EUR/USD shows that the pair trades near the lower end of its latest range, with an increased downward bias. Technical indicators extend their slides, leaving overbought territory. Still, the pair develops above bullish moving averages, suggesting any further slides may remain corrective. EUR/USD is currently approaching the 23.6% Fibonacci retracement of the latest daily advance at 1.1170, while the next Fibonacci support comes at 1.1105.
The 4-hour chart shows that the chances of a bearish extension are high, as the pair fell following another failed attempt to advance beyond its 20 Simple Moving Average (SMA), now providing dynamic resistance at around 1.1220. At the same time, technical indicators head south almost vertically within negative levels, reflecting prevalent near-term selling interest.
Support levels: 1.1170 1.1140 1.1105
Resistance levels: 1.1220 1.1275 1.1210
Author

Valeria Bednarik
FXStreet
Valeria Bednarik was born and lives in Buenos Aires, Argentina. Her passion for math and numbers pushed her into studying economics in her younger years.