EUR/USD Forecast: Bleeding to continue in the near term

EUR/USD Current Price: 0.9621
- Concerns about global growth fueled risk aversion at the beginning of the week.
- US Treasury yields soared to fresh multi-year highs, underpinning the dollar.
- EUR/USD struggles to retain the 0.9600 threshold as selling intensifies.
The EUR/USD pair plunged to a fresh multi-year low of 0.9549 in early Asia, later recovering towards 0.9701, from where it resumed its slump. It heads into Tuesday’s opening trading at around 0.9600, as the dismal ruling mood benefited the American currency for most of the day.
Investors continued to buy the dollar following central banks’ announcements last week, still pricing in more aggressive monetary policies to deal with inflation, which also means higher chances of economic recessions. Stocks sunk in the red, while US government bond yields reached fresh multi-year highs.
Meanwhile, macroeconomic data confirmed the gloomy picture. The German IFO survey showed that the Business Climate fell to 84.3 in September from 88.5 in the previous month. Expectations plummeted to 75.2 from 80.5, while the assessment of the current situation declined to 94.5. The US published the August Chicago Fed National Activity Index, down to 0 from 0.29 in July, and the September Dallas Fed Manufacturing PMI, which slid by less than anticipated, hitting -17.2.
On Tuesday, the focus will be on US figures, as the country will release August Durable Goods Orders, foreseen down by 1.1%, and CB Consumer Confidence, expected to have improved further in September, to 104.0 from 103.2 in August.
EUR/USD short-term technical outlook
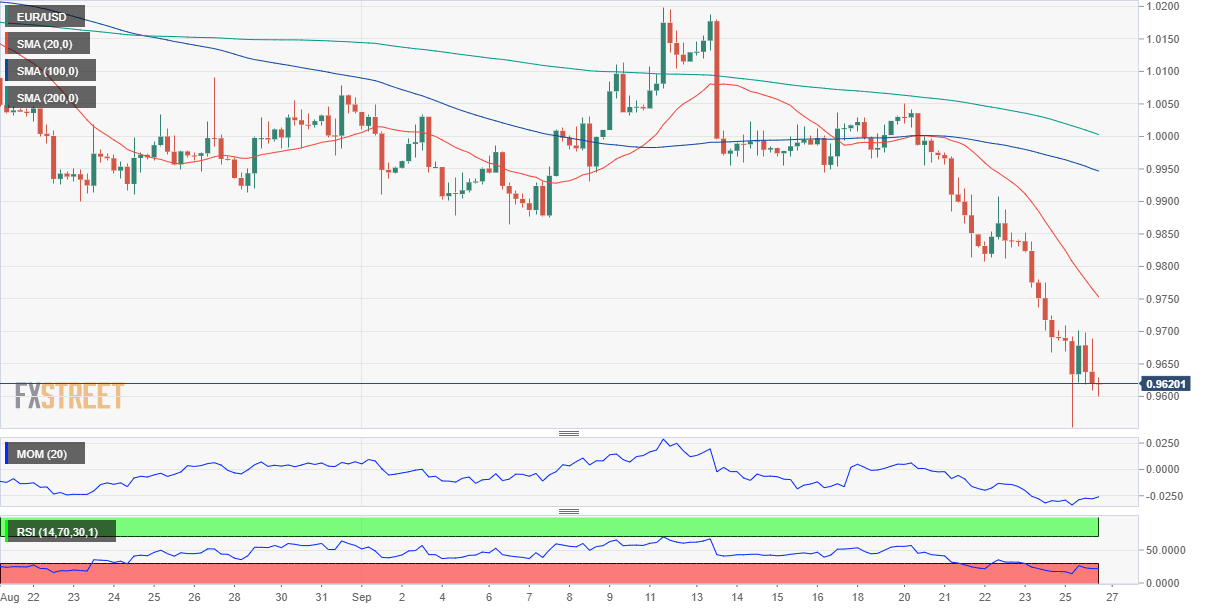
The daily chart for the EUR/USD pair shows that the bearish case remains strong. The pair is down for a fifth consecutive day and developing well below bearish moving averages. The 20 SMA is currently at around 0.9950, the level to surpass to hint at a more sustained bullish correction. Still, technical indicators head firmly lower, despite having reached oversold territory, suggesting bears retain control for now.
The 4-hour chart offers a similar picture, suggesting the decline will continue beyond the mentioned multi-year low. Technical indicators resumed their declines after correcting extreme readings, now again within oversold levels. The 20 SMA heads lower almost vertically, standing some 150 pips above the current level and far below also bearish longer ones.
Support levels: 0.9585 0.9550 0.9510
Resistance levels: 0.9640 0.9690 0.9730
Premium
You have reached your limit of 3 free articles for this month.
Start your subscription and get access to all our original articles.
Author

Valeria Bednarik
FXStreet
Valeria Bednarik was born and lives in Buenos Aires, Argentina. Her passion for math and numbers pushed her into studying economics in her younger years.


