EUR/USD Forecast: Battling 1.0900 ahead of central banks’ decisions

EUR/USD Current Price: 1.0890
- The US Federal Reserve will announce its decision on monetary policy during US trading hours.
- European inflation unexpectedly decreased to 8.5% YoY in January.
- EUR/USD has room to extend its gains from a technical perspective and reach 1.1000.
The EUR/USD pair trades in the 1.0890 price zone, up on Wednesday amid the broad US Dollar weakness. The Euro got an extra boost from macroeconomic figures, as the Euro Zone (EU) Harmonized Index of Consumer Prices (HICP) rise by less than anticipated in January, up at an annualized pace of 8.5% in January. The preliminary estimate indicates that inflationary pressures receded further at the beginning of the year after peaking last October at a multi-decade high of 10.6%.
The figure brings relief ahead of the European Central Bank (ECB) monetary policy decision to be announced on Thursday. However, speculative interest has its attention elsewhere today. The American session will bring the January ISM Manufacturing PMI, S&P Global estimate, employment-related data, and above all, the US Federal Reserve (Fed) monetary policy decision.
The US central bank is expected to slow the pace of tightening further and deliver a 25 bps rate hike. Still, market players doubt what Chairman Jerome Powell will say about the future. Indeed, price pressures have receded sharply in the US, but that falls short of granting inflation is already under control. American policymakers may well opt for maintaining a hawkish approach, somehow opposing to market’s hopes of a soon-to-come pivot. As a result, little action is expected across the FX board ahead of the event.
EUR/USD short-term technical outlook
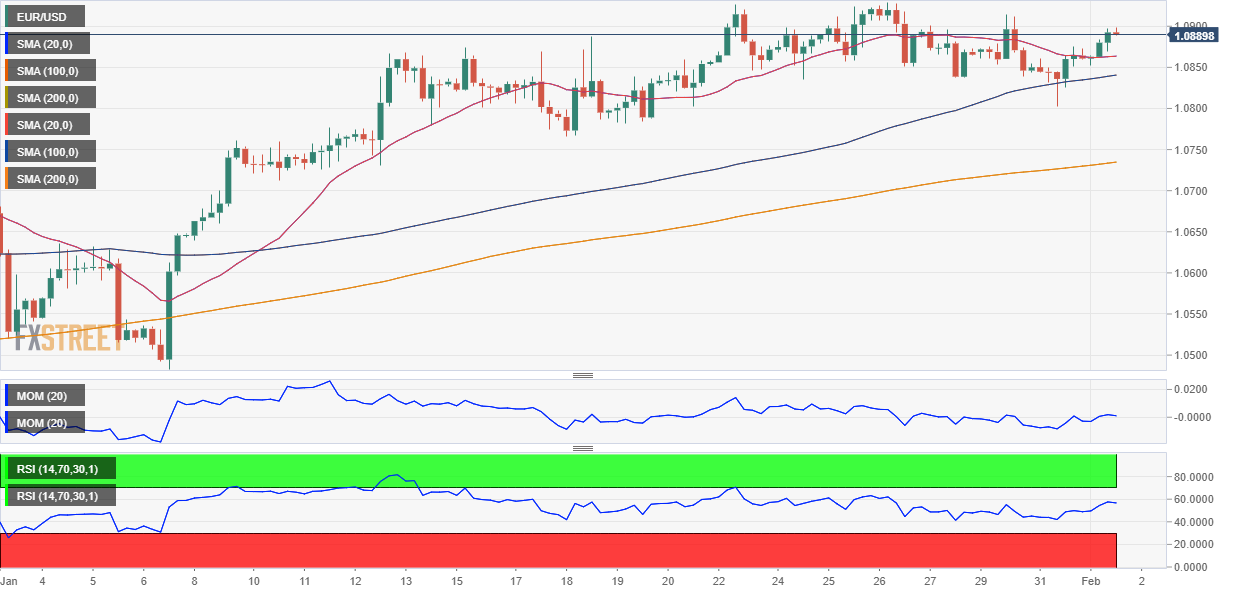
Ahead of the US Fed decision, the EUR/USD pair has flirted the 1.0900 level but has been unable to extend gains beyond it. The daily chart shows that the pair is up for a second consecutive day, although the upward strength is limited. The pair is developing above a bullish 20 SMA, which provides dynamic support at around 1.0795. At the same time, the 100 SMA is about to cross above the 200 SMA in the 1.0300 area. Finally, the Momentum indicator keeps heading lower, approaching its 100 line, while the Relative Strength Index (RSI) regained the upside and currently stands at around 64. The risk skews to the upside, although with central banks in the way, anything can happen.
In the near term, and according to the 4-hour chart, the pair is developing above a flat 20 SMA, which reflects the consolidative phase the pair is undergoing since mid-January. The longer moving averages, however, head higher below the shorter one, in line with the wider long-time bullish stance. Finally, technical indicators crossed their midlines into positive territory, heading modestly higher.
Support levels: 1.0840 1.0795 1.0745
Resistance levels: 1.0930 1.0985 1.1020
Author

Valeria Bednarik
FXStreet
Valeria Bednarik was born and lives in Buenos Aires, Argentina. Her passion for math and numbers pushed her into studying economics in her younger years.


