EUR/USD Forecast: Additional losses likely if 1.0150 is confirmed as resistance
- EUR/USD has extended its slide in the early European session on Tuesday.
- The pair could suffer further losses in case 1.0150 support fails.
- Investors await ZEW Survey findings and US housing data.

EUR/USD has declined to its lowest level in nearly two weeks below 1.0140 in the early European session on Tuesday but managed to stage a rebound. The near-term technical outlook points to oversold conditions but the pair is likely to suffer additional losses unless buyers continue to defend 1.0150.
Escalating fears over a global economic slowdown forced investors to seek refuge on Monday and the greenback capitalized on safe-haven flows. The US Dollar Index gained nearly 0.8% on the first trading day of the week, causing EUR/USD to fall sharply.
Meanwhile, low water levels on the Rhine River and the German government's proposal to introduce a gas levy for consumers weigh on the European economic outlook and hurt the shared currency.
Later in the session, ZEW Survey for the euro area and Germany will be looked upon for fresh impetus. Investors expect the Economic Sentiment Index in the euro area to improve to -42.5 in August from -51.1 in July while forecasting the German Economic Sentiment Index to remain steady at -53.8. In case these figures fall short of market expectation, EUR/USD is likely to stay under bearish pressure with investors refraining from betting on a potential euro recovery.
In the second half of the day, Housing Starts and Building Permits data for July will be featured in the US economic docket. The housing market has been feeling the negative impact of rising interest rates and a significant drop in these data could limit the dollar's upside by causing investors to reassess the Fed's rate outlook.
EUR/USD Technical Analysis
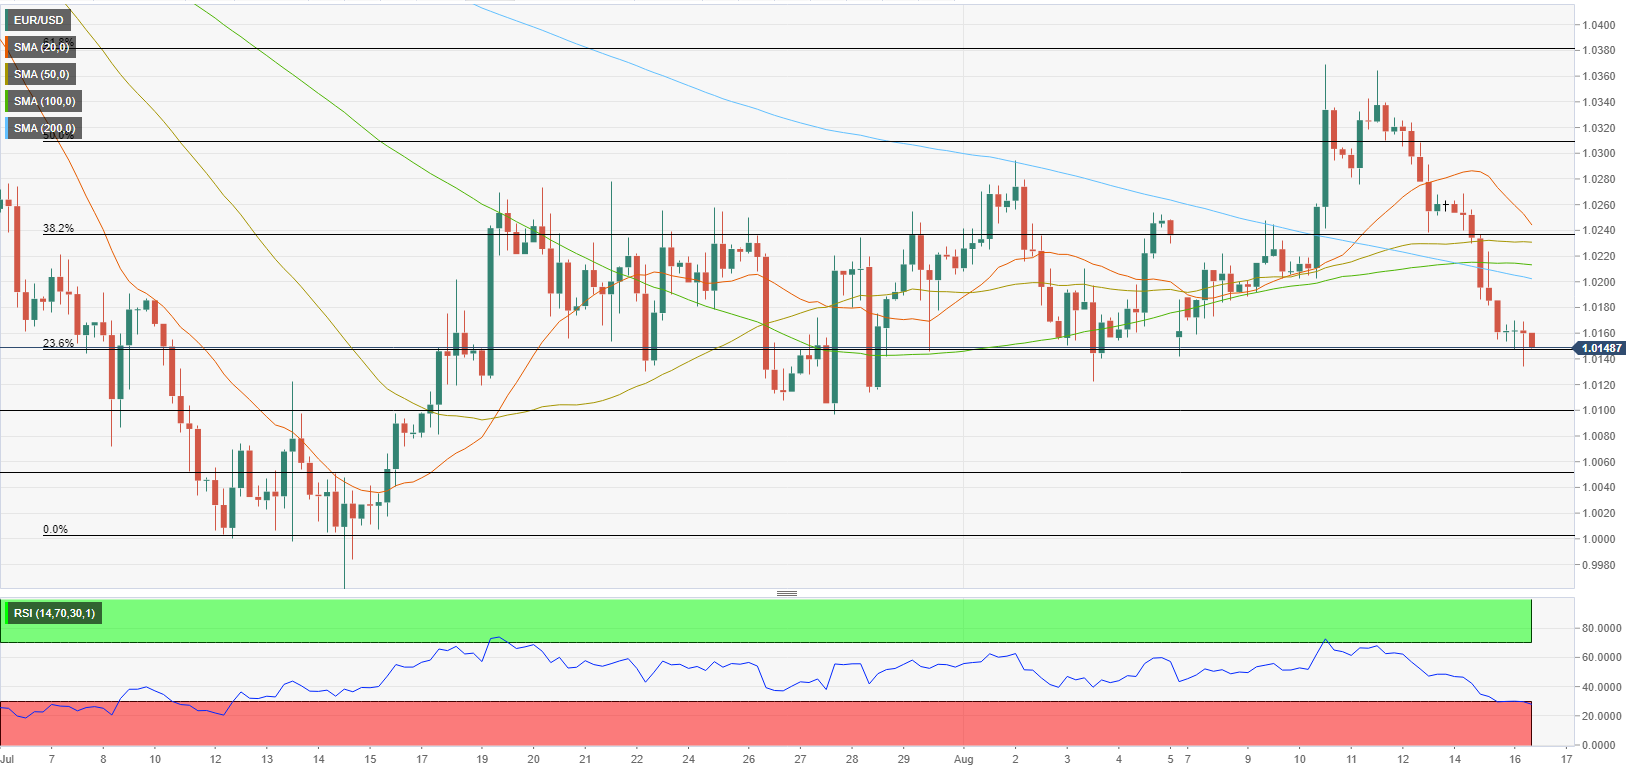
The Relative Strength Index (RSI) indicator on the four-hour chart stays below 30, suggesting that EUR/USD could make a technical correction before the next leg lower. 1.0150 (Fibonacci 23.6% retracement of the latest downtrend) aligns as first support. In case the pair falls below that level and starts using it as resistance, it could continue to fall toward 1.0100 (static level, psychological level) and 1.0050 (static level).
On the upside, 1.0200/1.0210 (200-period SMA, 100-period SMA) forms the first resistance area before 1.0230 (Fibonacci 38.2% retracement) and 1.0300 (Fibonacci 50% retracement).
Premium
You have reached your limit of 3 free articles for this month.
Start your subscription and get access to all our original articles.
Author

Eren Sengezer
FXStreet
As an economist at heart, Eren Sengezer specializes in the assessment of the short-term and long-term impacts of macroeconomic data, central bank policies and political developments on financial assets.


