EUR/USD Forecast: A slide through 1.0900 still on the cards

EUR/USD Current Price: 1.0983
- The US Dollar resumed its advance amid speculation the Fed will continue hiking rates.
- The Euro got hit by dismal German data, also weighed by a sour mood.
- EUR/USD is losing bearish strength but still at risk of falling.
The US Dollar resumed its advance following Friday’s retracement, with EUR/USD currently trading at around 1.0980, not far from its daily low of 1.0964. Concerns about additional rate hikes in the United States (US) boosted government bond yields, which remain below last week’s peaks. The 10-year Treasury note currently yields 4.11%, up 5 basis points (bps). At the same time, stock markets quick-started the week on the back foot, with most Asian and European indexes shedding ground.
Hawkish comments from US Federal Reserve (Fed) policymakers were behind the latest concerns as Governor Michelle Bowman said the Fed should remain willing to raise the policy rate if data show that progress on inflation has stalled. Also, Atlanta Fed President Raphael Bostic argued that the central bank should keep monetary policy in a restrictive territory well into 2024. New York’s John Williams poured some cold water during London trading hours, as he said that he does not rule out the possibility of cutting rates early in 2024, adding it would depend on economic data.
Data-wise, Germany published June Industrial Production, which fell 1.5% MoM and 1.7% compared to a year earlier, missing expectations and hitting the Euro. As for the Eurozone, the region released August Sentix Investor Confidence, which improved from -22.5 in July to -18.9. The US calendar does not have relevant data scheduled, although the country will publish the July Consumer Price Index (CPI) next Thursday.
EUR/USD short-term technical outlook
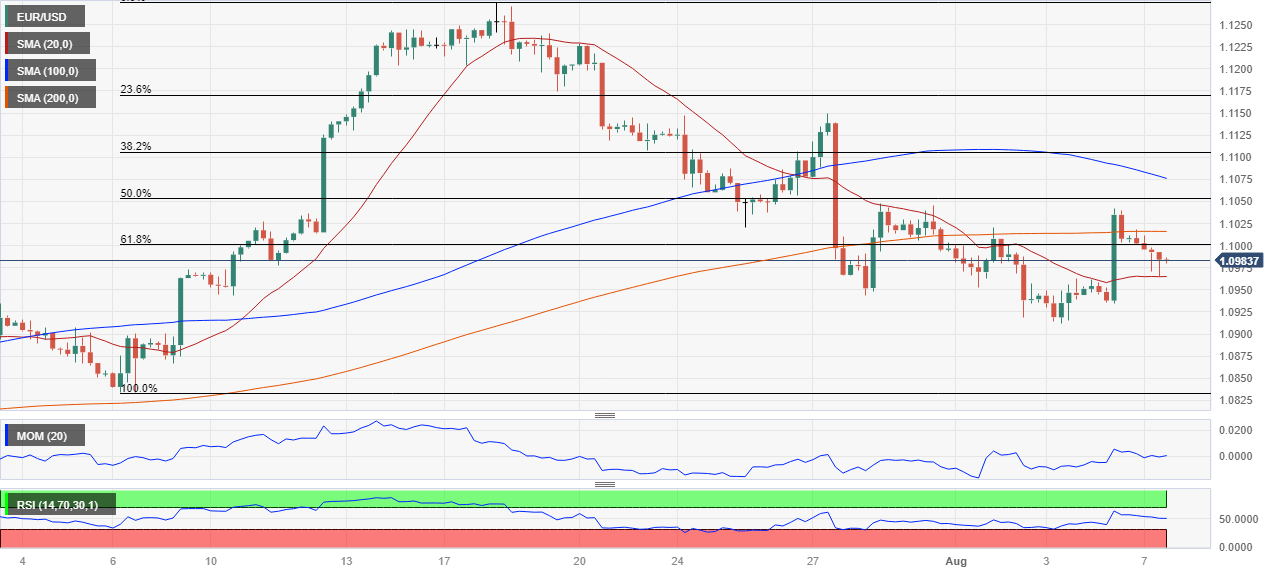
The EUR/USD pair retreats from an early high of 1.1014 and trades below the 61.8% retracement of the 1.0833/1.1275 rally at around 1.1005, maintaining the risk skewed to the downside. The daily chart shows that the Momentum indicator consolidates within negative levels, while the Relative Strength Index (RSI) indicator turned lower at around 47, both in line with another leg lower. Finally, the 20 Simple Moving Average (SMA) turned directionless while above the current level, while the 100 SMA provides dynamic support at around 1.0920.
In the near term, and according to the 4-hour chart, chances of a bearish extension seem limited. EUR/USD met buyers around a flat 20 SMA, while the 100 SMA gains downward traction far above the current level. At the same time, technical indicators are aiming north within neutral levels, suggesting easing seller interest at the time being.
Support levels: 1.0960 1.0920 1.0870
Resistance levels: 1.1005 1.1065 1.1105
Author

Valeria Bednarik
FXStreet
Valeria Bednarik was born and lives in Buenos Aires, Argentina. Her passion for math and numbers pushed her into studying economics in her younger years.