|

EUR/USD eyes 2023 top after quick rally

  • EUR/USD returns to positive trend after Powell confirms dovish policy adjustment.

  • Technical signals reflect weakening positive bias; next resistance could be at 1.1240-1.1274.

EURUSD

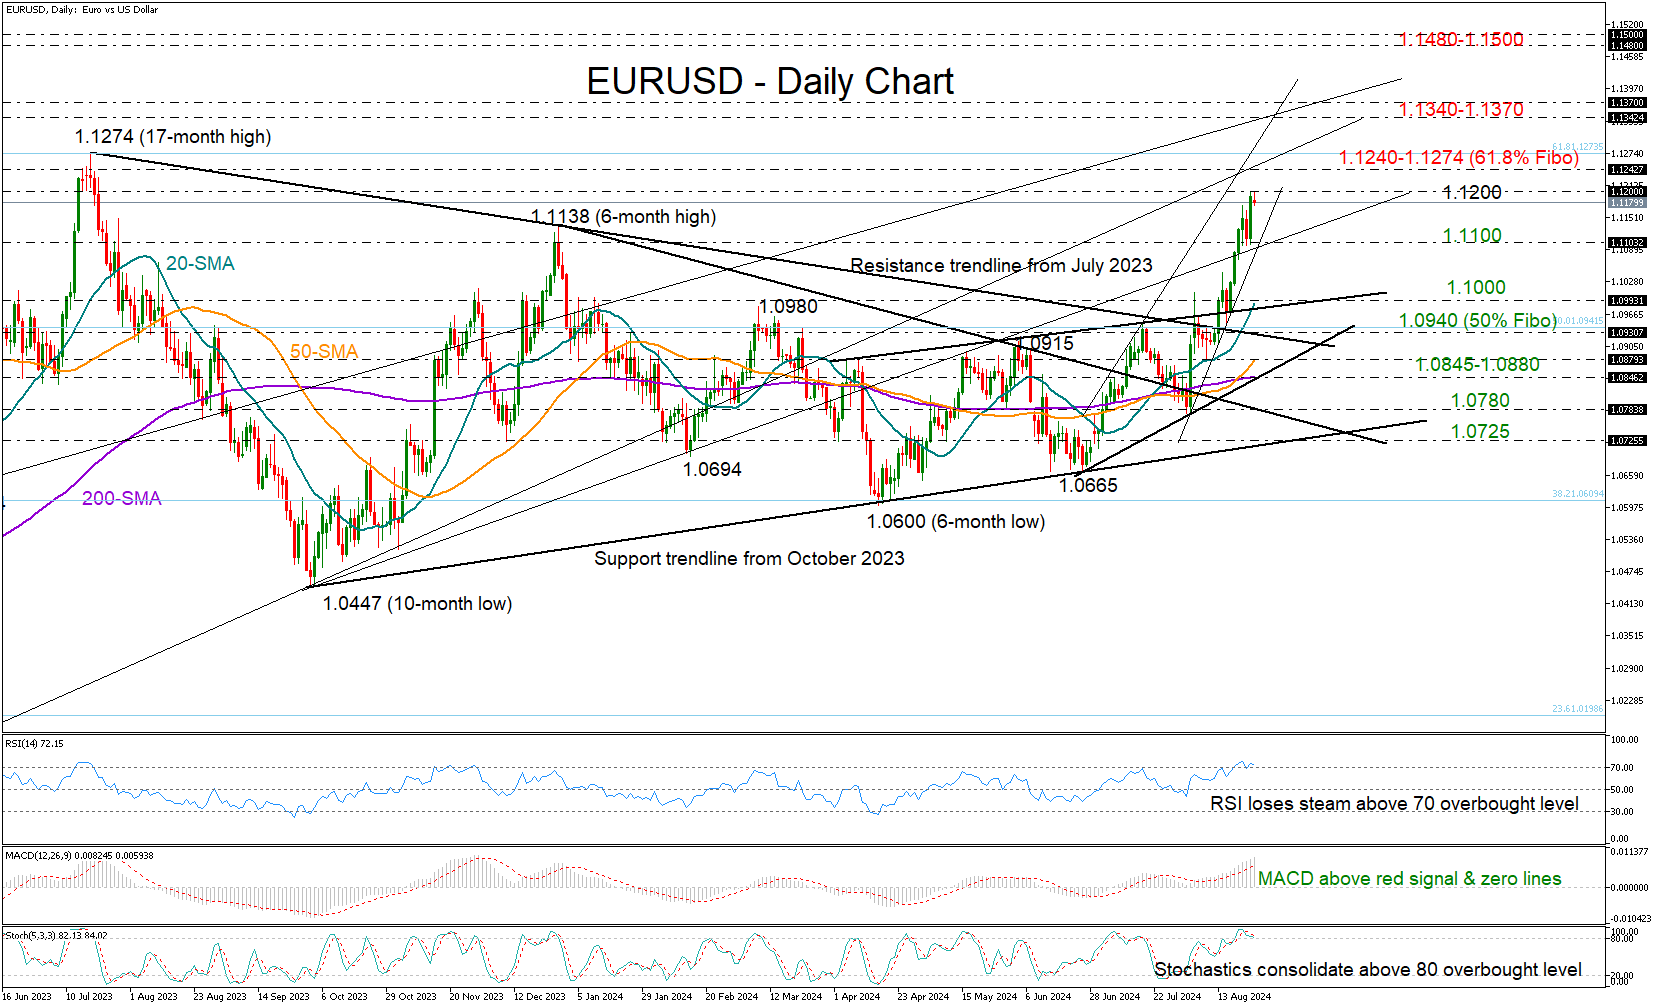
EURUSD has had a great August so far, rising sharply from 1.0776 to nearly 1.1200 to mark its best monthly performance since November 2022.

The pair violated a bearish engulfing candlestick pattern after refusing to close below 1.1100 on Friday, increasing optimism that the rally might have more room to run. Nevertheless, it is crucial to be cautious as the RSI and stochastic oscillator display weakness in the overbought zone, indicating that selling interest persists.

The 1.1240-1.1274 area, which includes the 61.8% Fibonacci retracement of the 2021-2022 downtrend and the trendline from the 2022 trough, could keep the bulls busy in the short term. A move higher could hit a wall somewhere between 1.1340 and 1.1370, with the latter being a tough obstacle during November 2021-February 2022. If the battle there is won, it could trigger substantial buying up to the 2022 double top region of 1.1480.

Looking to the downside, a close below 1.1100 might lead the price towards the 20-day simple moving average (SMA) seen near 1.1000. A move lower could shift all the attention to the 50% Fibonacci of 1.0940 and the broken resistance trendline from July 2023. Then, the 50- and 200-day SMAs at 1.0880 and 1.0845 respectively could block an extension to 1.0780. If this does not occur, selling pressure could stretch towards the 1.0725 region.

All in all, EURUSD exited its 2024 sideways trajectory and might aim for new higher highs, though for a meaningful rally, it might need to cross above the 2023 barrier of 1.1240-1.1274.

Author

Christina Parthenidou

Christina joined Trading Point in May 2017. She holds a master degree in Economics and Business from the Erasmus University Rotterdam with a specialization in International economics.


More from Christina Parthenidou
Share:

Editor's Picks

AUD/USD sits at two-month lows near 0.6950 after Australian CPI data

AUD/USD is sitting at two-month lows near 0.6950 in the Asian session on Wednesday, as below-expectations August Australian underlying CPI data pours cold water on expectations for further RBA interest rate hikes. Chinese PMI data also fail to inspire the Australian Dollar, despite a pause in the US Dollar advance.

USD/JPY stays weak below 157.00 amid Japanese intervention risks

USD/JPY keeps losses below 157.00 in the Asian session on Wednesday, as hawkish BoJ expectations, along with intervention risks, underpin the Japanese Yen, countering dismal domestic factory output and retail sales data. Meanwhile, a broad US Dollar retreat also collaborates to the pair's downside.

Gold flat lines below $4,200, as focus shifts to US ADP and PCE

Gold extends its consolidative price move in the European session, trading near the $4,200 mark. Falling US bond yields drag the US Dollar away from the two-month high, touched on Tuesday, and act as a tailwind for the commodity. However, hawkish US Federal Reserve expectations cap the upside as traders await important US macro data before placing fresh directional bets on the non-yielding bullion.

Bitcoin consolidates below $85,000 amid rising US Treasury yields, derivatives deleveraging

Bitcoin consolidates near $83,000 at the time of writing on Wednesday after bulls failed to close above the key $85,000 level earlier this week. The Crypto King's investors remain cautious amid rising US Treasury yields and several key macroeconomic data releases due this week.

US core PCE inflation set to rise in August, pressuring the Federal Reserve

The United States Bureau of Economic Analysis will publish the Personal Consumption Expenditures Price Index data for August on Wednesday at 12:30 GMT. Market participants closely watch the PCE Price Index because it is the Federal Reserve’s preferred measure of inflation and could influence its policy outlook.

Silver is more volatile than Gold ahead of PCE and NFP. This chart shows the positioning gap
The market’s attention is focused on American data this week, but there’s something only those with a trained eye may be looking at: Gold and Silver positioning gap. Financial markets are moving on fears, mostly related to persistently high energy prices driven by the Middle East war. Sure, the US Dollar (USD) is strong, but at what cost?