|

EUR/USD enjoys robust support, can it rally?– Confluence Detector

EUR/USD is trading in a narrow range around 1.1300 as the long Easter weekend approaches. The pair enjoys substantial support. Can it rally? 

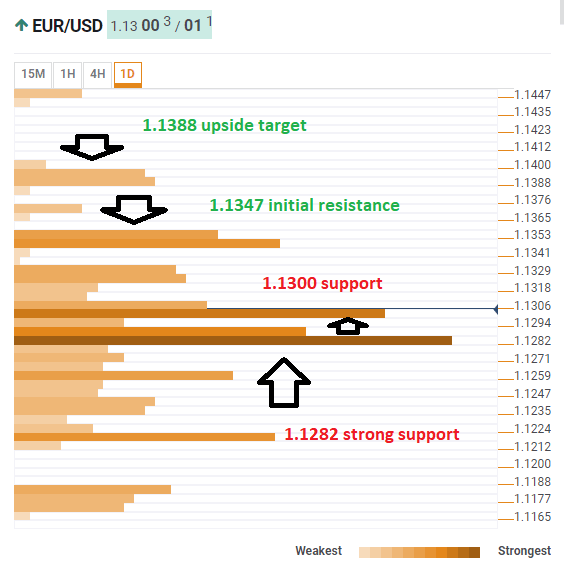
The Technical Confluences Indicator shows that the round number of 1.1300 is a dense cluster of lines including the Simple Moving Average 5-1h, the Fibonacci 61.8% one-day, the SMA 10-15m, the SMA 10-1h, the SMA 10-4h, the SMA 50-1h, the SMA 5-4h, the SMA 50-1d, the Bollinger Band 1h-Middle, and more.

More significant support awaits at 1.1282 where we see the convergence of the previous daily low, the Fibonacci 38.2% one-month, the SMA 200-1h, the Fibonacci 38.2% one-week, the BB 4h-Lower, and the SMA 5-1d. 

The initial upside target is 1.1347 where the Fibonacci 61.8% one-month, the Pivot Point one-week R1, the BB 1d-Upper, and the SMA 100-1d.

Further above, 1.1388 is the next target where the PP 1w-R2 meets the PP 1m-R1.

Here is how it looks on the tool:

EUR USD technical confluence April 18 2019

Confluence Detector

The Confluence Detector finds exciting opportunities using Technical Confluences. The TC is a tool to locate and point out those price levels where there is a congestion of indicators, moving averages, Fibonacci levels, Pivot Points, etc. Knowing where these congestion points are located is very useful for the trader, and can be used as a basis for different strategies.

This tool assigns a certain amount of “weight” to each indicator, and this “weight” can influence adjacents price levels. These weightings mean that one price level without any indicator or moving average but under the influence of two “strongly weighted” levels accumulate more resistance than their neighbors. In these cases, the tool signals resistance in apparently empty areas.

Learn more about Technical Confluence

Author

Yohay Elam

Yohay Elam

FXStreet

Yohay is in Forex since 2008 when he founded Forex Crunch, a blog crafted in his free time that turned into a fully-fledged currency website later sold to Finixio.

More from Yohay Elam
Share:

Editor's Picks

USD/JPY stays below 160.50 as markets assess BoJ decision

USD/JPY fluctuates in a relatively narrow range above 160.00 on Tuesday as markets assess the Bank of Japan's (BoJ) decision to raise the policy rate by 25 at the June meeting. Meanwhile, investors keep a close eye on news coming out of the Middle East, while preparing for the critical Fed meeting.

AUD/USD trades in tight channel near 0.7050 despite hawkish RBA message

AUD/USD trades modestly lower on the day at around 0.7050 on Tuesday as markets adopt a cautious stance amid a lack of details surrounding the US-Iran peace agreement. The Reserve Bank of Australia (RBA) left the door open for possible policy tightening after leaving the interest rate unchanged, as expected, at the June meeting but failed to boost the Australian Dollar.

Gold clings to moderate gains above $4,300 following Monday's rally

Gold maintains a mildly positive tone, holding gains after rallying about 6% over the last few days. The precious metal's recovery, however, has lost steam after crossing the $4,300 line as the initial enthusiasm about the US-Iran peace deal faded, with investors moving to the sidelines in anticipation of details of the agreement and monetary policy decisions by the Fed.

Solana's rebound gains momentum as ETF inflows return

Solana (SOL) steadies at $73 after posting three consecutive green candlesticks since the weekend. The recent recovery is supported by institutional demand, with spot Exchange Traded Funds recording net inflows of $2.81 million on Monday.

BoJ just hiked and US-Iran deal is on the table: Why Japanese Yen is still around 160.00

The Bank of Japan lifted interest rates from 0.75% to 1.00%, its highest level in more than three decades. The landmark move aims to stabilize a sharply weakening Japanese Yen, but by looking at the immediate market reaction, it doesn’t look like it’s going to work.

4.2% headline, 0.2% core: Why the Fed's next hike may be targeting the wrong problem

May's CPI put headline inflation at 4.2% on the year, up from 3.8% in April and the hottest reading since April 2023, while core prices rose just 0.2% on the month, undershooting the 0.3% consensus and halving April's pace.