Solana Price Forecast: SOL rebound gains momentum as ETF inflows return
- Solana trades at $73.74 on Tuesday after extending three consecutive green candlesticks since the weekend.
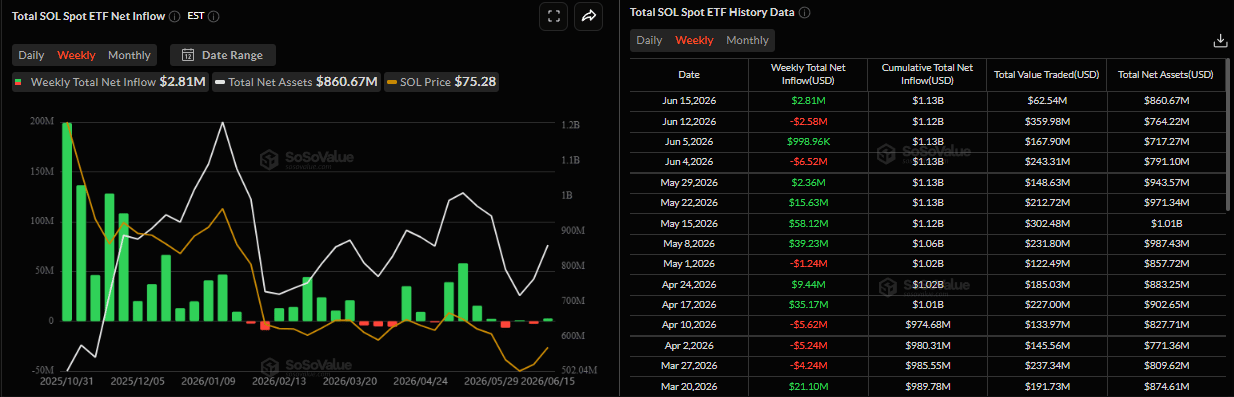
- US-listed spot ETF recorded an inflow of $2.81 million on Monday, signaling institutional interest.
- The technical outlook supports further recovery as momentum indicators show fading bearish strength.

Solana (SOL) steadies at $73 on Tuesday after posting three consecutive green candlesticks since the weekend. The recent recovery is supported by institutional demand, with spot Exchange Traded Funds (ETFs) recording net inflows of $2.81 million on Monday. On the technical side, fading bearish pressure, as shown by momentum indicators, suggests that SOL could extend its rebound.
Institutional demand returns
Institutional demand for SOL began the week on a positive note. SoSoValue data showed that spot Solana ETFs recorded an inflow of $2.81 million on Monday, reversing the previous week’s net outflows of $2.58 million. The shift marks an early sign of renewed institutional interest. If inflows continue to strengthen throughout the week, SOL could see further recovery ahead.
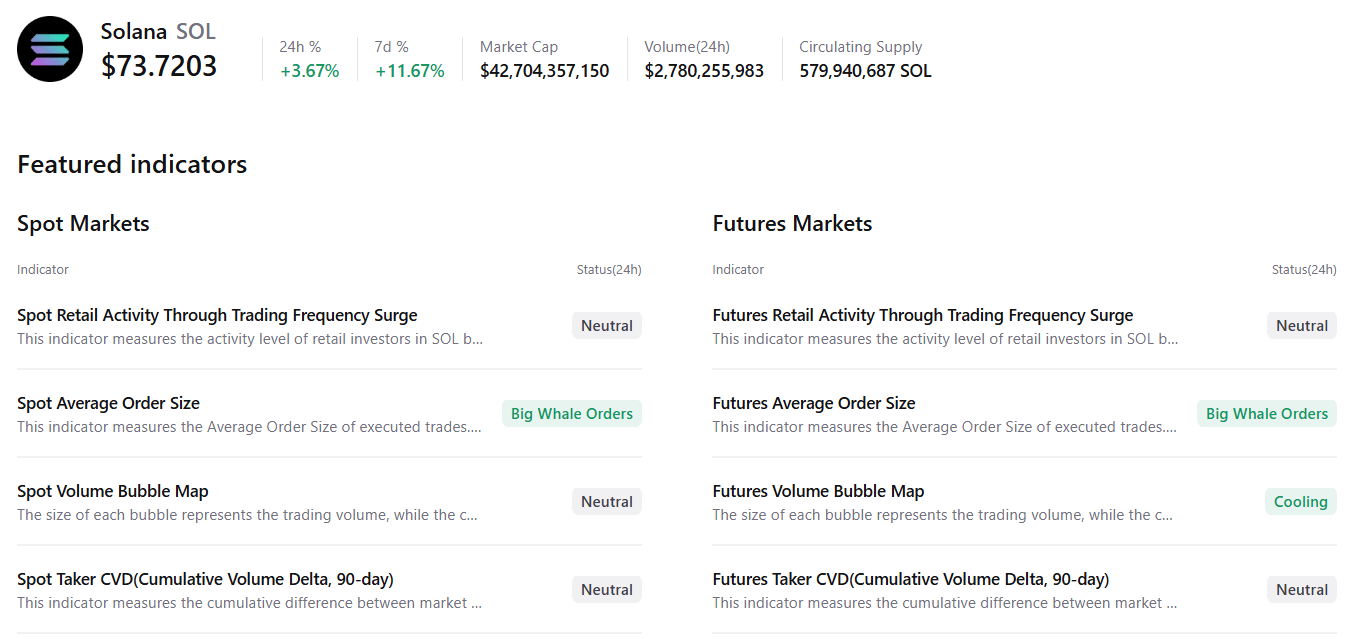
CryptoQuant’s summary data also supports a bullish outlook. SOL’s spot and futures markets show large whales’ orders and cooling conditions with neutral conditions in other metrics, supporting a potential recovery.
Some signs of concern
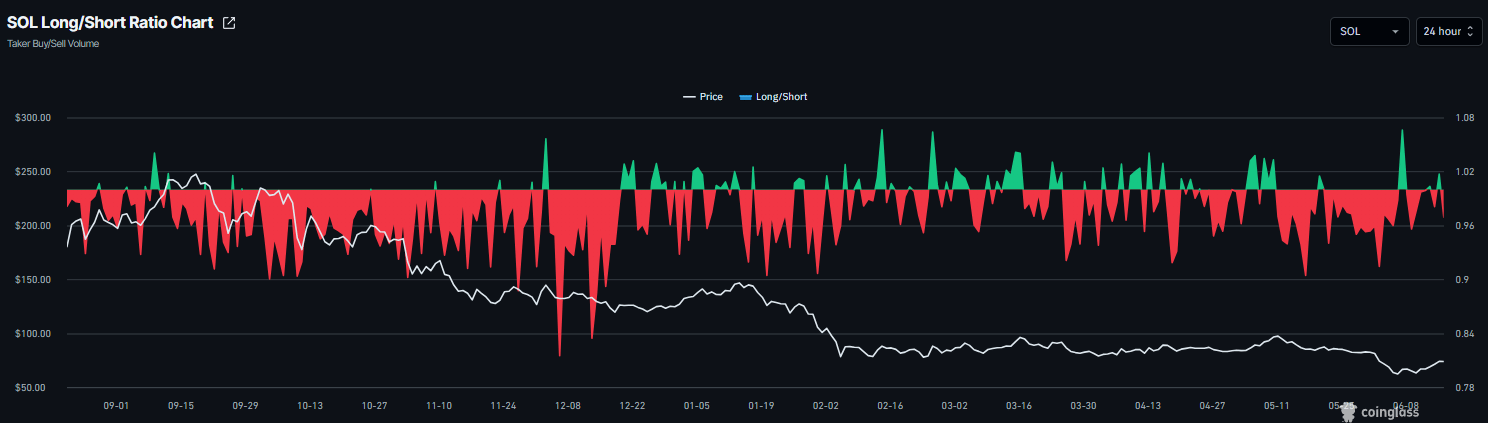
Despite positive ETF flows and metrics, SOL’s derivatives data show a slight bearish tilt, capping its upside potential. CoinGlass’ long-to-short ratio for SOL read 0.96 on Tuesday. The ratio being below one, indicates bearish sentiment, as traders are betting the assets’ prices will fall.
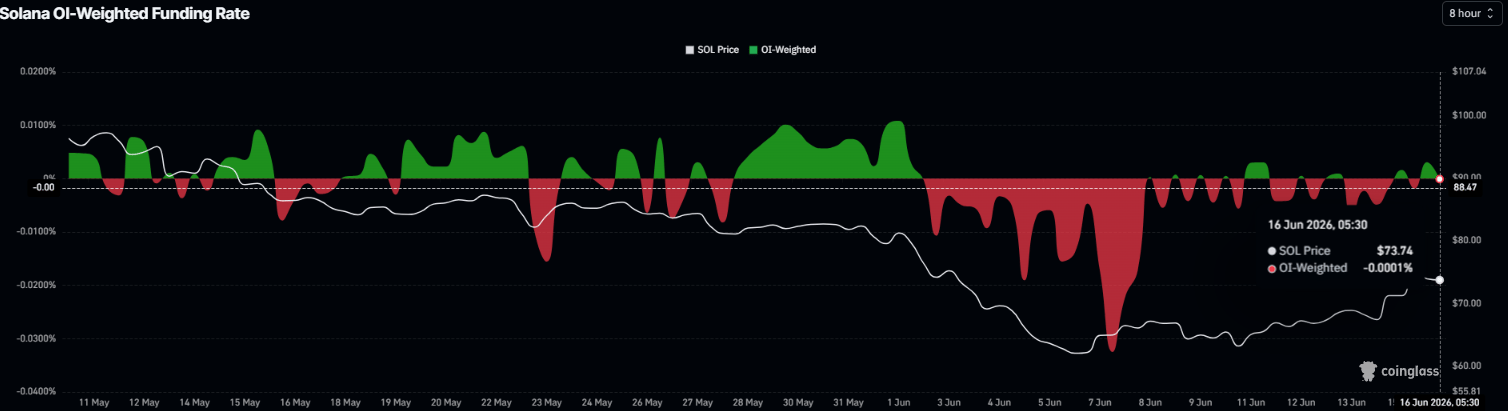
Meanwhile, the funding rates turn negative, reading -0.001% on Tuesday, indicating that shorts are paying longs and projecting bearish sentiment.
Solana Price Forecast: Fading bearish strength
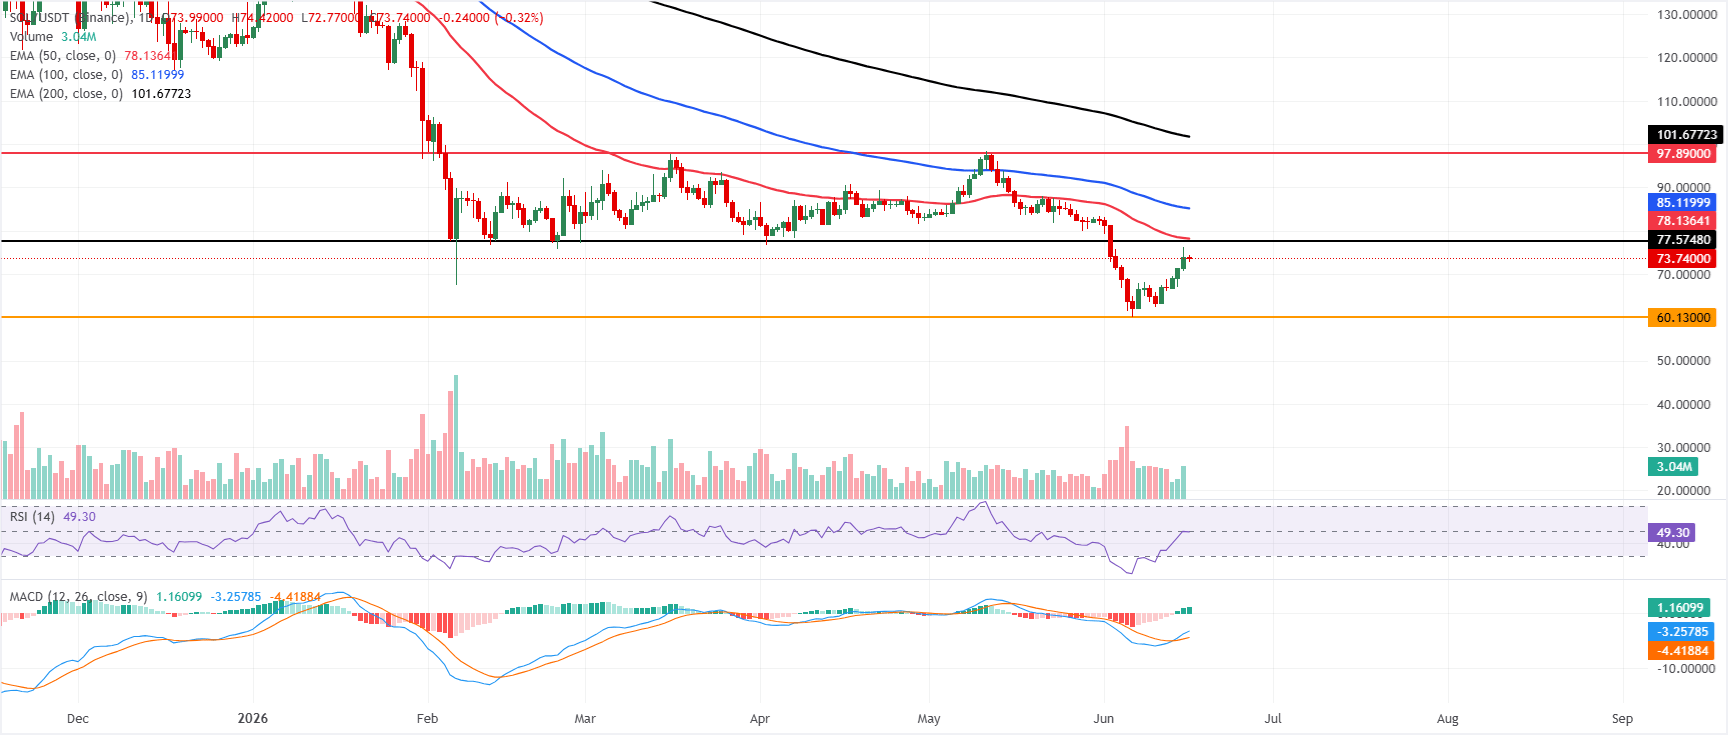
Solana price trades at $73.74 on Tuesday after recovering over 11% in the last three days. However, SOL is maintaining a bearish bias as it remains capped beneath a dense band of Exponential Moving Averages (EMAs). The 50-day EMA at $78.13, the 100-day EMA at $85.11 and the distant 200-day EMA at $101.67 all sit overhead, suggesting rallies are likely to face supply.
Momentum is stabilizing rather than outright negative, with the Relative Strength Index (RSI) hovering near a neutral 49 and the Moving Average Convergence Divergence (MACD) turning positive, hinting that the latest rebound is more corrective within a broader capped structure.
On the topside, initial resistance is seen at the horizontal barrier near $77.57, reinforced just above by the 50-day EMA at $78.13; a daily close over this cluster would be needed to ease immediate downside pressure. Further hurdles emerge at the 100-day EMA around $85.11, ahead of the $97.89 horizontal level and the 200-day EMA at $101.67, which together define a major supply zone.
On the downside, the key support to watch sits at the prior horizontal floor near $60.13, where a break would reopen the broader downside and negate the current consolidation attempt.
(The technical analysis of this story was written with the help of an AI tool.)
Author

Manish Chhetri
FXStreet
Manish Chhetri is a crypto specialist with over four years of experience in the cryptocurrency industry.



