EUR/USD double divergence warning signal for strong uptrend
-
EUR/USD is showing double bearish divergence within the strong uptrend. What does the divergence on the 4 hour indicate for the start of the new trading year in 2021?
-
This article reviews the expected wave and chart patterns plus key targets and support and resistance levels.
-
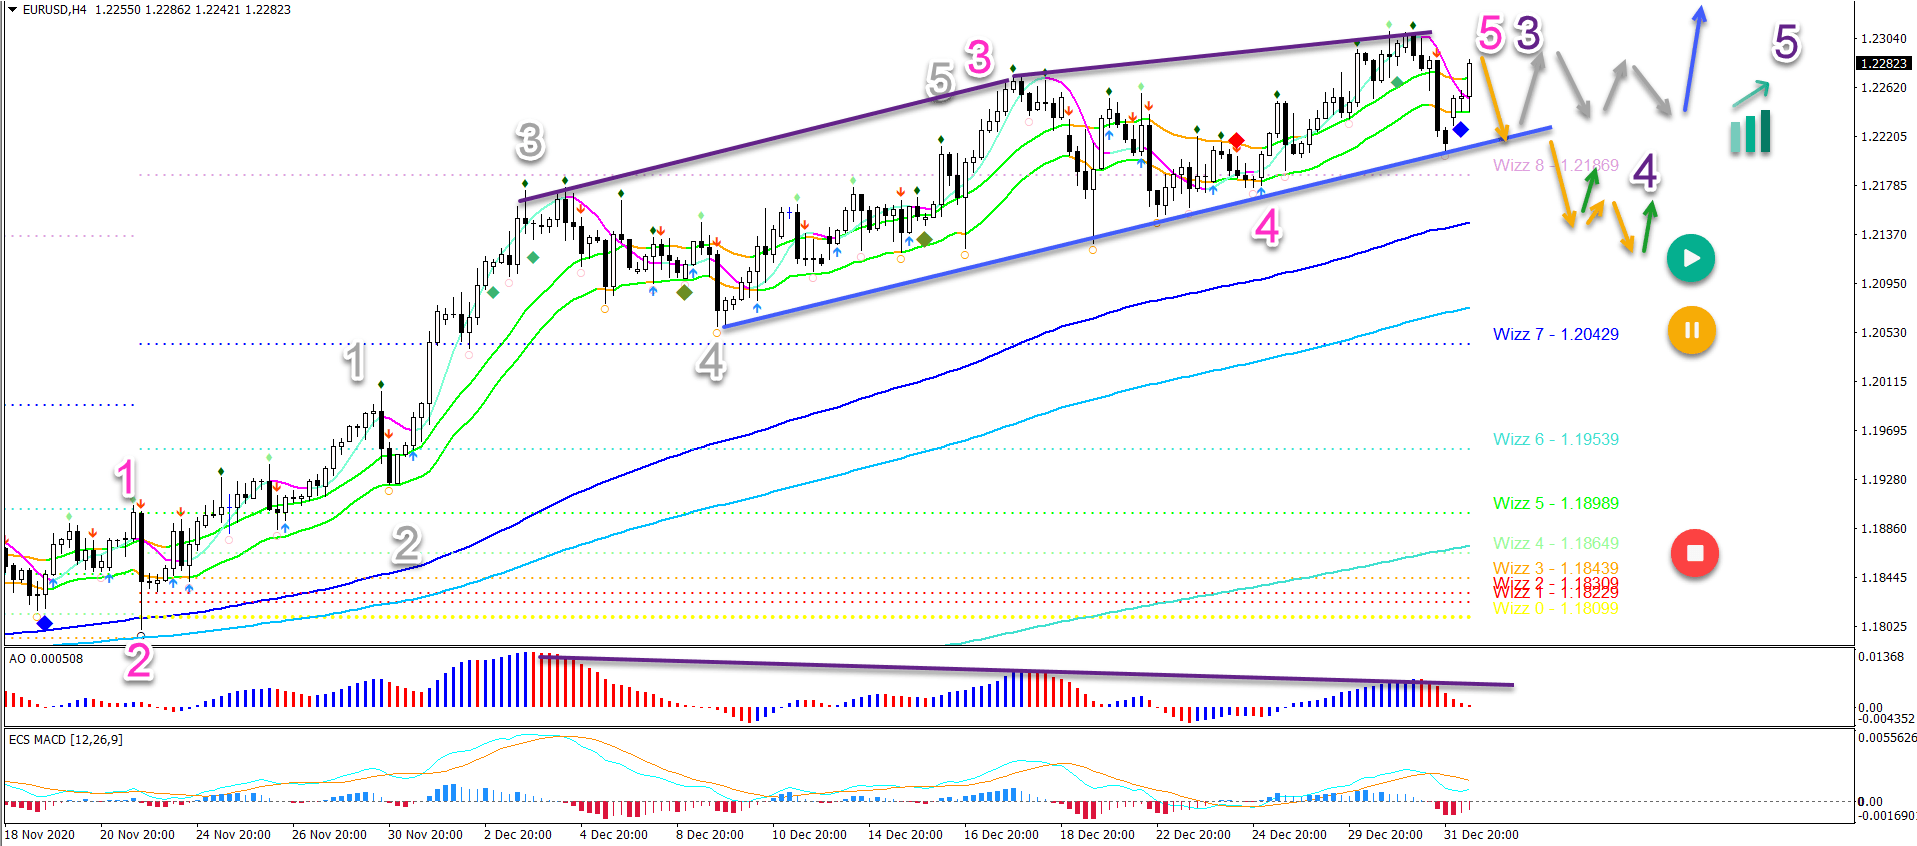
The EUR/USD double divergence is certainly a warning sign for the bulls. This increases the chance that a bearish retracement is likely to occur.
Price Charts and Technical Analysis
-
The main confirmation of a pullback is when price breaks below the support line (blue).
-
The main target for the bearish breakout (orange arrows) is the 144 ema zone.
-
The 144 ema is where the uptrend could continue and find support (blue arrows).
The other possibility is that the divergence pattern creates a pauze in the uptrend. A triangle chart pattern might emerge first (grey arrows).
An immediate breakout above the yearly high of 2020 is not expected right now. But any bullish continuation, now or later, is aiming at 1.24 and 1.25.
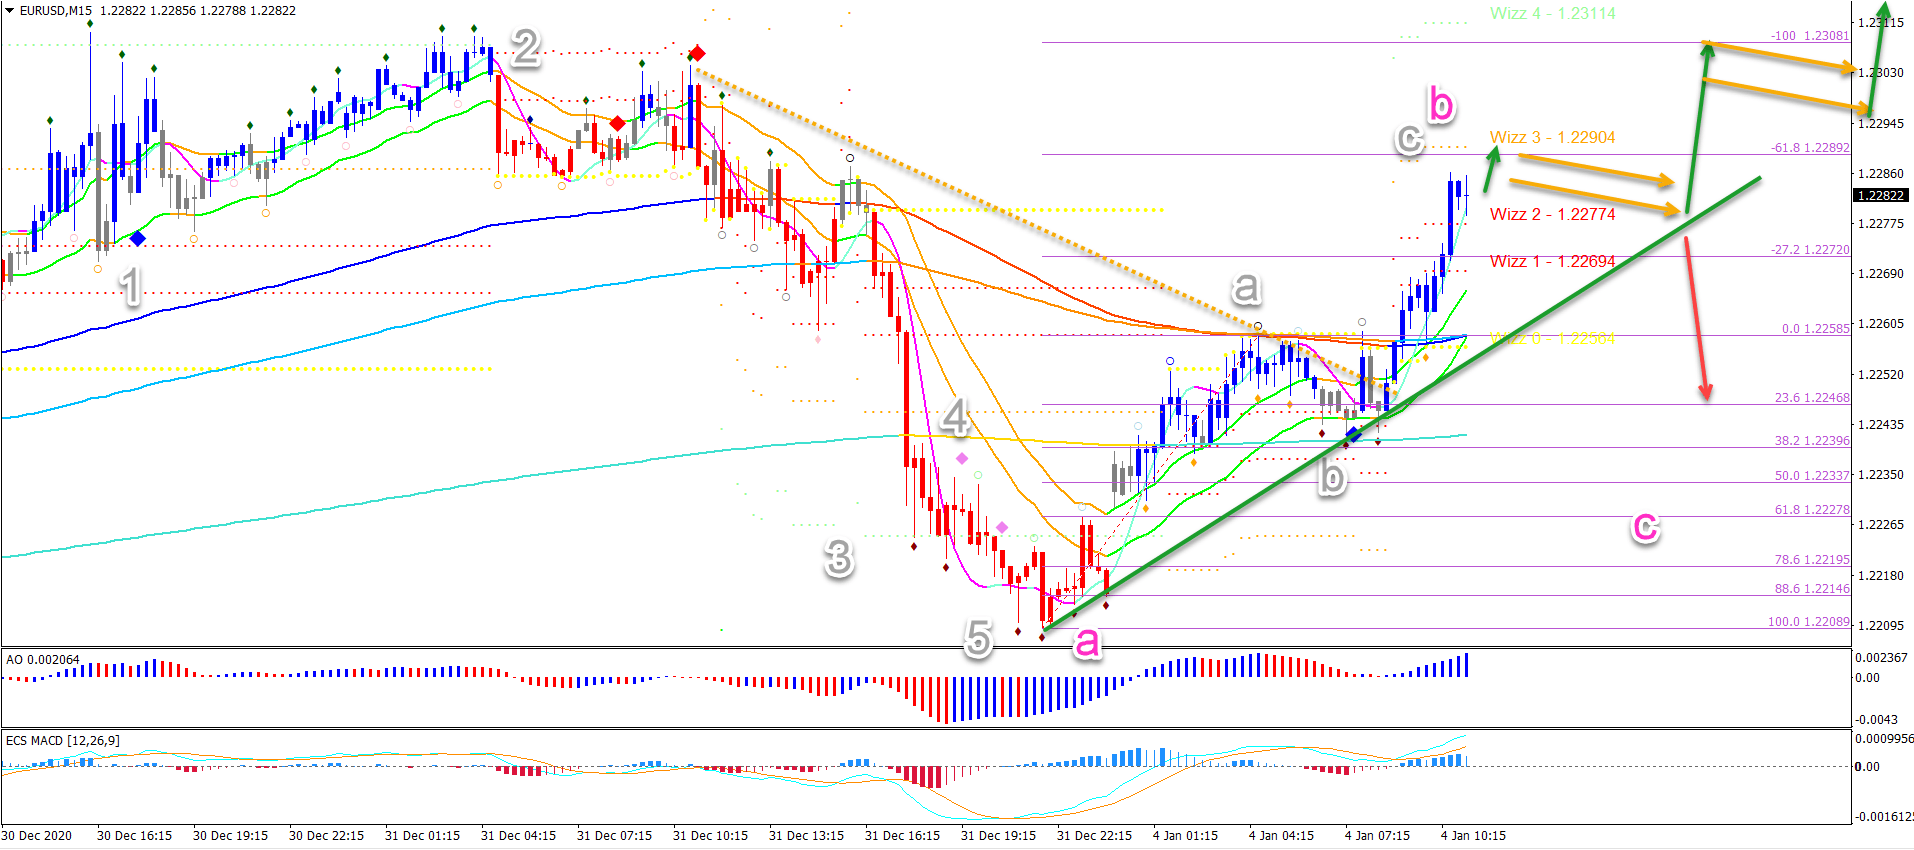
On the 15 minute chart, price action could be building a bullish ABC (grey) pattern. A bearish bounce could take place at resistance.
But for a larger retracement to take place, price action needs to break below the support (green) for a breakout (red arrow).
Bull flag patterns (orange arrows) could indicate that the bulls are too strong and could over rule the divergence on the 4 hour chart.
The analysis has been done with the ecs.SWAT method and ebook.
Author

Chris Svorcik
Elite CurrenSea
Experience Chris Svorcik has co-founded Elite CurrenSea in 2014 together with Nenad Kerkez, aka Tarantula FX. Chris is a technical analyst, wave analyst, trader, writer, educator, webinar speaker, and seminar speaker of the financial markets.


