EUR/USD: Bids and offers about even

Europe’s shared currency benefitted from the dollar downside in November, adding +2.9% and settling a whisker off best levels.
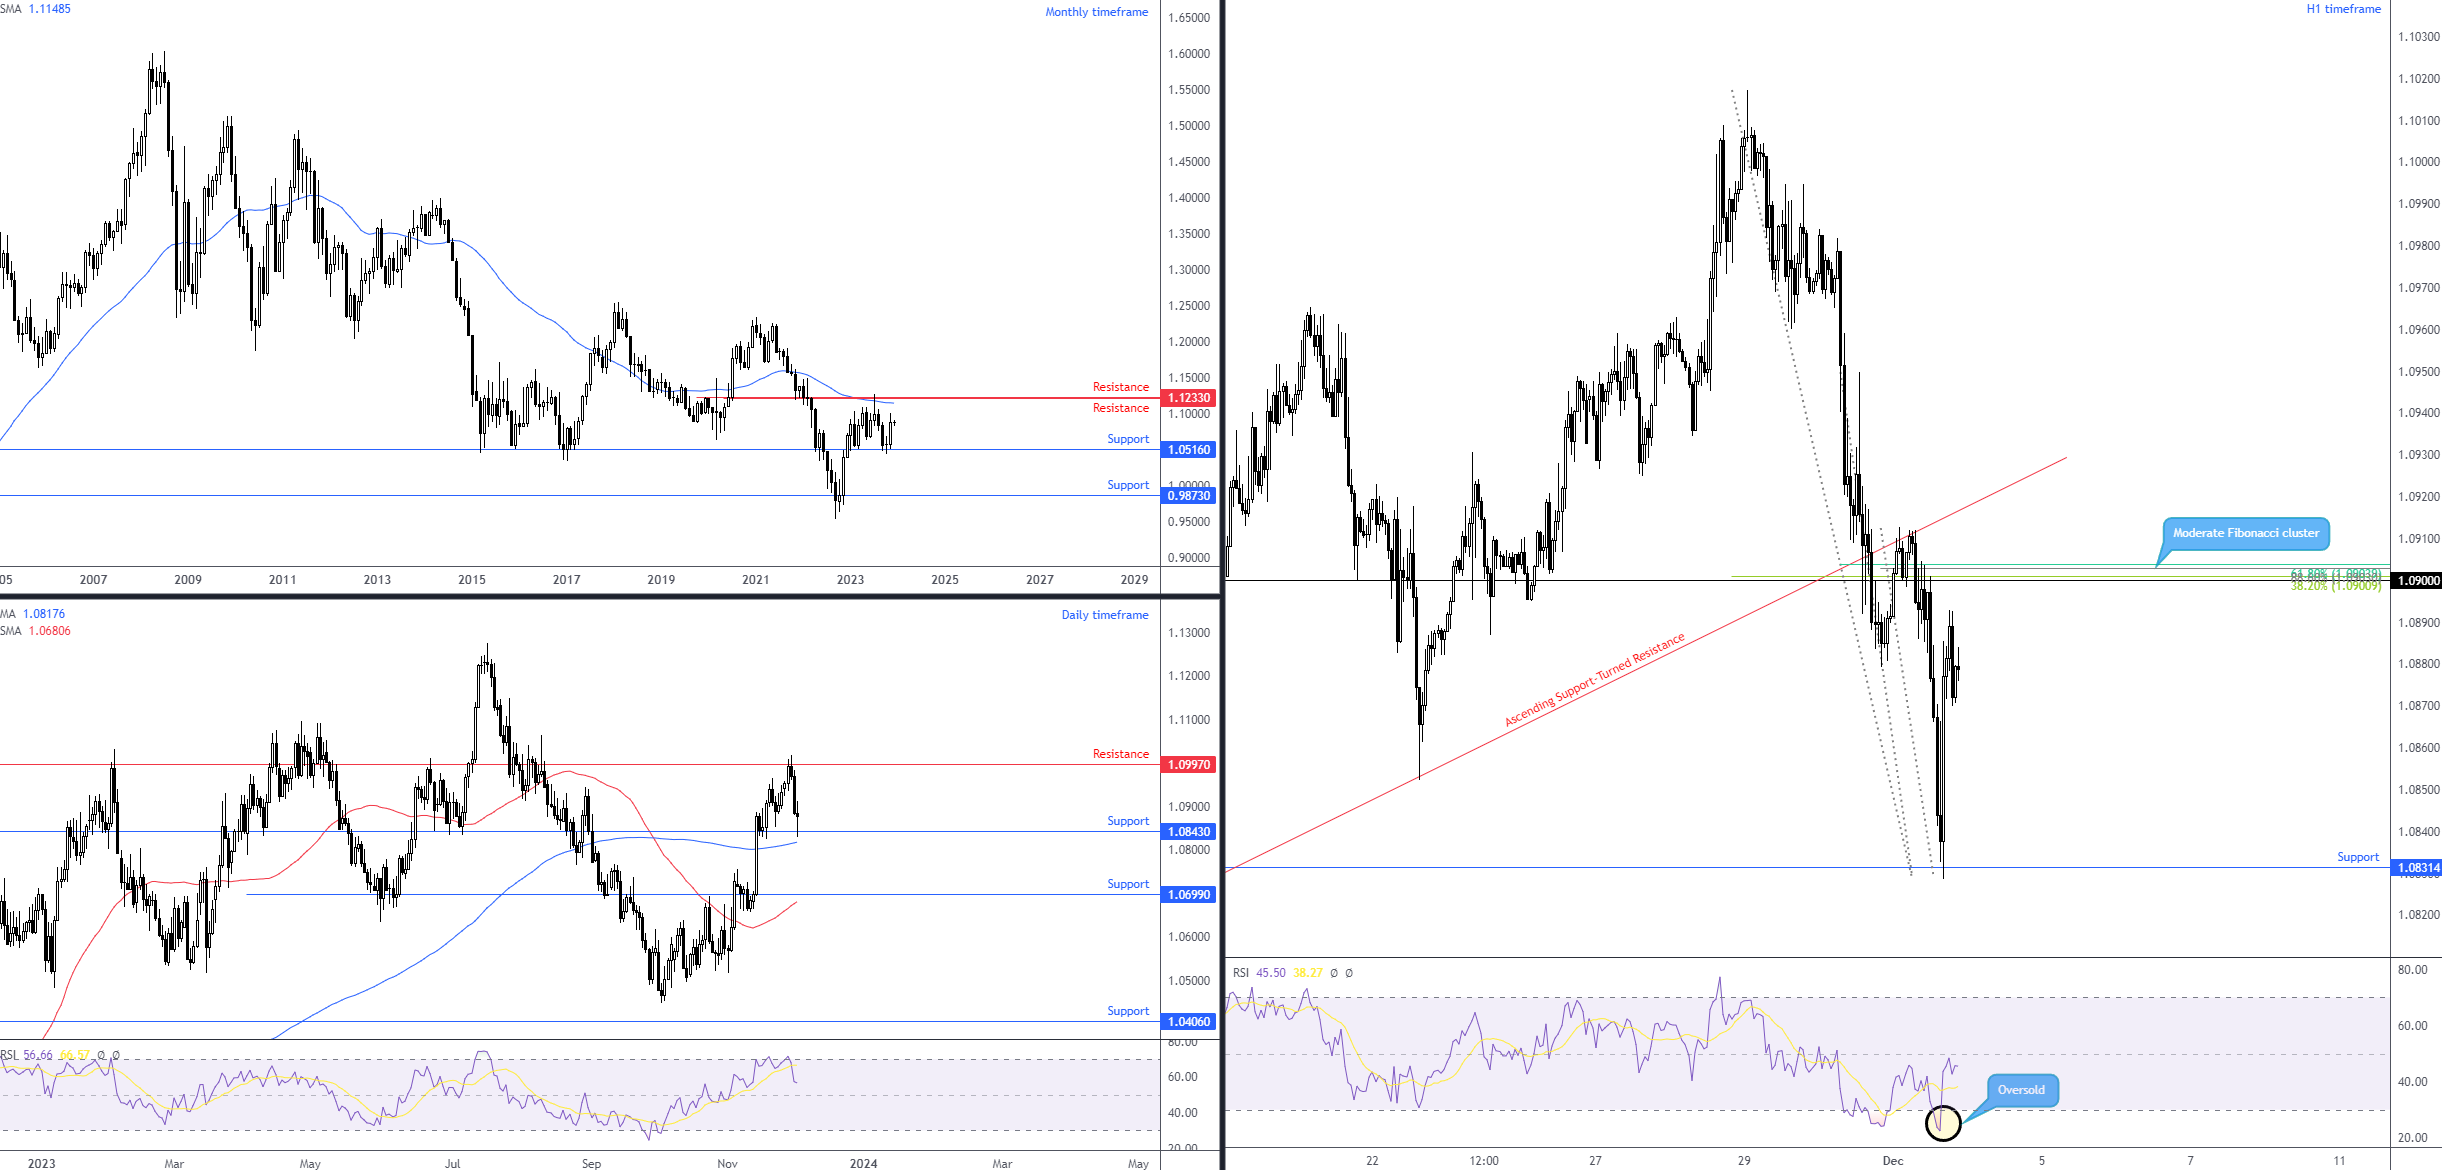
Monthly timeframe: Clear downtrend
Although the recent bid deserves notice—particularly as it followed a test of support on the monthly timeframe at $1.0516—the long-term trend leans in the seller’s favour, with a downtrend in play since 2008 (series of lower lows and lower highs). Overhead, resistance warrants attention at $1.1233, which shares chart space with a 50-month simple moving average (SMA) at $1.1149.
Therefore, although sellers could eventually take the reins, a move higher is still on the table to resistance at $1.1233, according to the monthly scale.
Daily timeframe: Support enters the fray amid moderate uptrend
The second half of the week saw EUR/USD bears take the wheel on the daily chart from resistance at $1.0997 (complemented by the Relative Strength Index [RSI] rolling over from overbought space), leading the currency pair to support at $1.0843 on Friday. Bolstering this support level is the nearby 200-day SMA at $1.0818. Stepping beneath the SMA this week (which would deliver a bearish trend reversal signal, yet many will also want to see the daily candles print a lower high and subsequent lower low to help determine an early downtrend) may liberate sellers to attack support from $1.0699, a level strengthened by the 50-day SMA at $1.0681.
Also worth noting, of course, is the RSI venturing near the upper side of the 50.00 centreline. Pushing through here would inform traders and investors that momentum to the upside has slowed to the point where average losses exceed average gains.
H1 timeframe: Resistance eyed
From a shorter-term perspective, price action rebounded from support at $1.0831 during US trading on Friday and shined the technical headlights on $1.09. This is a big figure that garners additional strength from a Fibonacci cluster, consisting of a collection of Fibonacci retracement ratios: 61.8%, 38.2% and a deep 88.6% ratio at $1.0904, $1.0901 and $1.0903, respectively.
This week?
The case for bulls and bears this week is about even.
The case for bulls consists of room to move higher on the monthly chart until resistance at $1.1233, the uptrend on the daily chart and daily support from $1.0843 entering the fight on Friday.
The case for bears, however, is the long-term downtrend evident on the monthly chart, daily RSI departing from overbought space and H1 resistance nearby at $1.09.
Charts: TradingView
Author

Aaron Hill
FP Markets
After completing his Bachelor’s degree in English and Creative Writing in the UK, and subsequently spending a handful of years teaching English as a foreign language teacher around Asia, Aaron was introduced to financial trading,


