EUR/USD: bearish extension towards 1.0910 now expected

EUR/USD Current price: 1.0947
View Live Chart for the EUR/USD
The EUR/USD pair jumped to its highest for the week, up to 1.1038, but reversed gains but quickly fell down to its lowest since the Brexit, printing 1.0934 ahead of Wall Street's opening. It was all about the ECB. The Central Bank left its economic policy unchanged, and within the press conference, Mario Draghi said that there was no discussion in extending QE, triggering the spike higher. Yet within the press conference, it was clear that they didn't discuss tapering either, or in fact anything. Policy makers will wait until fresh data in December before making a decision.
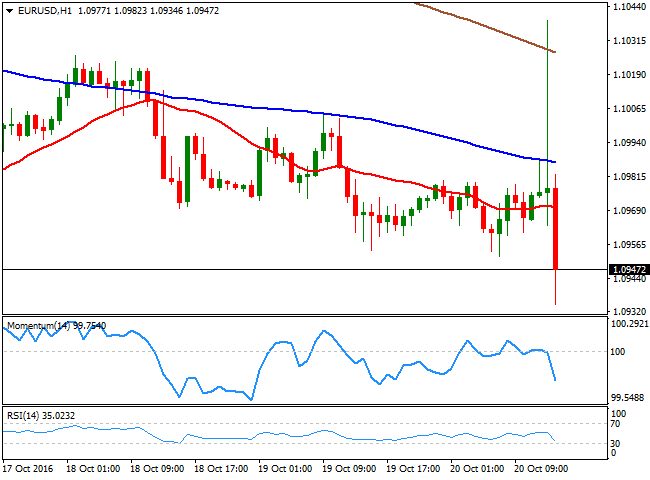
The EUR/USD pair looks quite vulnerable intraday, as in the 1 hour chart, the spike was capped by a bearish 200 SMA, and that the price is now below all of its moving averages, whilst the technical indicators head sharply lower within negative territory. Furthermore, the pair seems unable to advance beyond 1.0950, July's low. In the 4 hours chart, the 20 SMA maintains its bearish slope above the current level, while the technical indicators also support a downward extension, heading south within negative territory. The immediate support is 1.0910, the post-Brexit low, with a break below it opening doors for a steeper decline towards the 1.0800/40 region.
Support levels: 1.0910 1.0870 1.0840
Resistance levels: 1.0950 1.1000 1.1035
GBP/USD Current price: 1.2231
View Live Chart for the GBP/USD
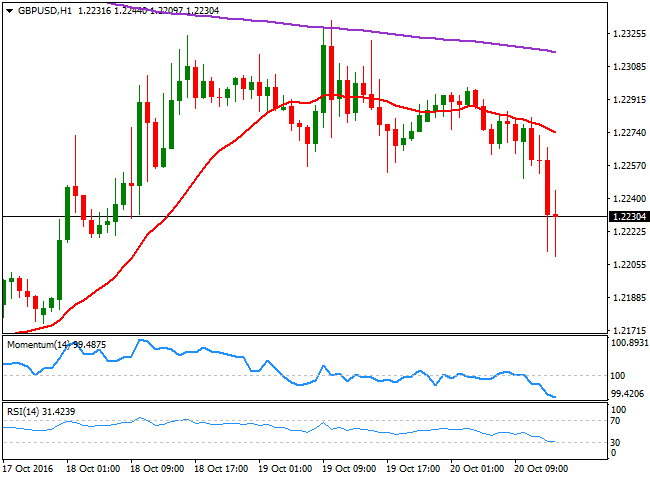
The GBP/USD pair fell down to 1.2209, hit early London after the release of disappointing UK retail sales figures. Retail Sales remained flat monthly basis in September, printing 0.0%, while the year-on-year figre resulted at 4.1%. Despite being a solid number, it was below market's expectations of 4.8% or previous 6.6%. The spike of EUR demand sent the EUR/GBP beyond the 0.9000 level, weighing further on the Pound, and whilst EUR's strength receded, the USD/GBP was unable to recover ground. Short term, the 1 hour chart shows that the price is now well below a bearish 20 SMA, now around 1.2270, while technical indicators have partially lost downward momentum, but hold well below their mid-lines. In the 4 hours chart, the price broke below its 20 SMA for the first time this week, while technical indicators continued declining from overbought levels, and are currently entering bearish territory, implying increasing selling interest.
Support levels: 1.2210 1.2170 1.2125
Resistance levels: 1.2260 1.2300 1.2340
USD/JPY Current price: 103.69
View Live Chart for the USD/JPY
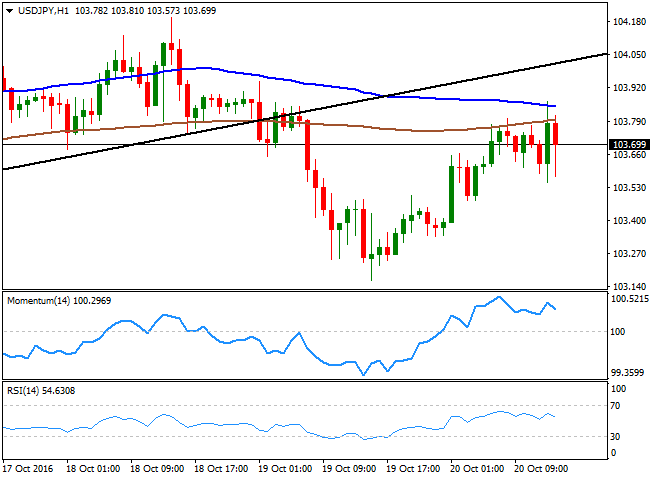
Neutral-to-bullish, 104.20 is key. The USD/JPY pair trades modestly higher, although still below the 104.00 mark, as mixed US employment data released alongside with ECB's press conference was not enough to trigger buying interest. US weekly unemployment claims came in at 260K from a previously revised 247K and against the 250K expected. The Philadelphia FED manufacturing survey however, beat expectations at 9.7, but still below previous 12.8. The downside is limited by the strong bounce seen in equities after the ECB's press conference, leaving a neutral stance in the pair for the short term. In the 1 hour chart, the price is below its 100 and 200 SMAs, with the shortest at 103.85, while technical indicators turned lower within positive territory, but showing no directional strength. In the 4 hours chart, the price holds well above a bullish 100 SMA, now around 103.05, although technical indicators have retreated from their mid-lines, in line with the shorter term outlook. A recovery above 104.20 is what it takes to see the pair advancing further, towards the weekly high in the 104.60 region.
Support levels: 103.40 103.00 102.60
Resistance levels: 103.85 104.20 104.60
Author

Valeria Bednarik
FXStreet
Valeria Bednarik was born and lives in Buenos Aires, Argentina. Her passion for math and numbers pushed her into studying economics in her younger years.


