EUR/USD Awaits Critical Breakout of Triangle Pattern

Meta description:
EUR/USD bounced at the 50% Fibbut price was unable to make a higher high andnow needs to break above resistance to confirm wave C.
EUR/USD
4 hour
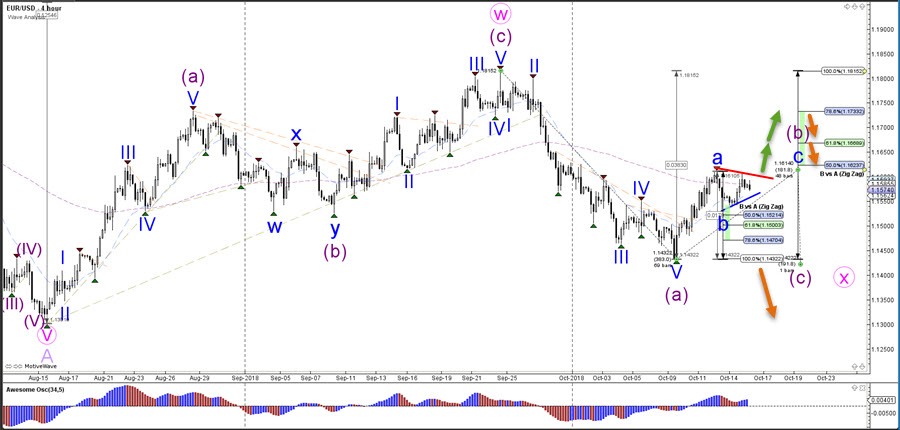
The EUR/USD bounced at the 50% Fibonacci level of wave B (blue) but price was unable to make a higher high. Price needs to break above the resistance line (red) to confirm the wave C (blue) breakout.
The EUR/USD seems to be building a bullish ABC (blue) pattern within wave B (purple) unless price breaks below the 100% Fib level of wave B vs A. A break below support (blue) indicates a potential deeper retracement within wave B (blue).
1 hour
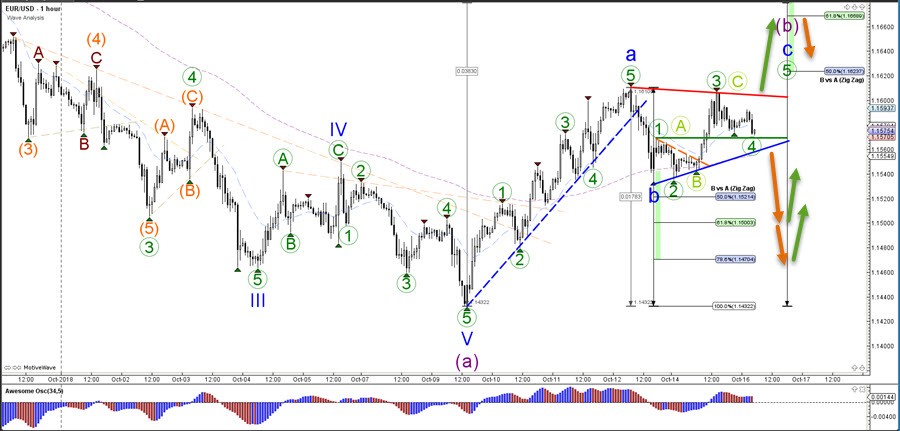
The EUR/USD is either building a 123 or ABC wave pattern, which depends on whether price bounces at the support level (green). A bearish break indicates a move down to theFibonacci support levels of wave B (blue) whereas a bullish break could see price move higher towards the Fibonacci targets.
Author

Chris Svorcik
Elite CurrenSea
Experience Chris Svorcik has co-founded Elite CurrenSea in 2014 together with Nenad Kerkez, aka Tarantula FX. Chris is a technical analyst, wave analyst, trader, writer, educator, webinar speaker, and seminar speaker of the financial markets.


