|

EUR/USD at risk of a downside correction

Key highlights

  • EUR/USD is struggling to clear the 1.0925 resistance zone.
  • A key support is forming near 1.0800 on the 4-hours chart.

EUR/USD technical analysis

Looking at the 4-hours chart, the pair traded as high as 1.0929 and is currently consolidating in a range. There was a minor decline below the 1.0900 level. However, the pair is trading well above the 100 simple moving average (red, 4-hours) and the 200 simple moving average (green, 4-hours).

On the downside, there is a major support at 1.0800 and the 100 simple moving average (red, 4-hours). A downside break below the 1.0800 zone might push the pair lower.

eurusd chart

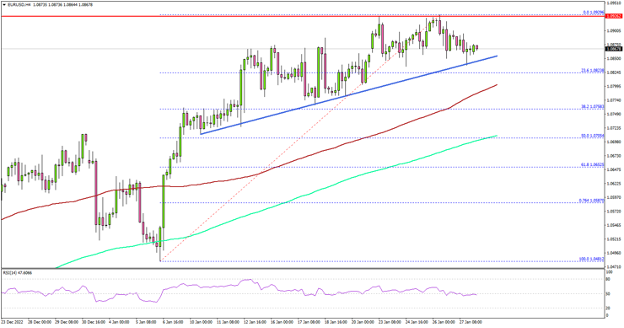
The next major support sits near the 1.0700 level and the 200 simple moving average (green, 4-hours). Any more losses might open the doors for a move towards the 1.0580 support zone.

On the upside, the pair is facing resistance near 1.0920. The first major resistance is near the 1.0950 level. A clear move above the 1.0950 resistance might start a steady increase towards the 1.1000 resistance zone.

Any more gains could open the doors for a move towards the 1.1080 level. The next key hurdle is near 1.1200, above which the pair could climb towards the 1.1320 resistance zone.

Author

Aayush Jindal

I have spent over six years as a financial markets contributor and observer, and possess strong technical analytical skills. I am a software engineer by profession, loves blogging and observing financial markets.

More from Aayush Jindal
Share:

Markets move fast. We move first.

Orange Juice Newsletter brings you expert driven insights - not headlines. Every day on your inbox.

By subscribing you agree to our Terms and conditions.

Editor's Picks

EUR/USD bears await break below 100-day SMA support near 1.1665 area

The EUR/USD pair attracts heavy selling for the second straight day and dives to a nearly four-week trough, around the 1.1670 region, during the Asian session on Monday. Bearish traders now await a sustained break below the 100-day Simple Moving Average before positioning for an extension of the recent pullback from a three-month top, or levels just above the 1.1800 mark touched on December 24.

GBP/USD falls toward 1.3400 near 50-day EMA

GBP/USD extends its losses for the second successive session, trading around 1.3420 during the Asian hours on Monday. The technical analysis of the daily chart indicates that the 14-day Relative Strength Index at 53 has eased from near overbought, indicating that momentum has cooled while remaining above the midline. RSI holds above 50, keeping a modest bullish bias.

Gold on fire at the start of the week on US-Venezuela tensions

Gold regains upside traction early Monday as flight to safety prevails on Venezuela turmoil. The US Dollar finds strong haven demand, caps Gold’s upside as focus shifts to US jobs data. Gold’s daily technical setup suggests that more upside remains in the offing.

Bulls firmly in control as Bitcoin breaks $93K, Ethereum and Ripple extend gains

Bitcoin, Ethereum, and Ripple extended their rallies on Monday, gaining more than 4%, 6%, and 12%, respectively, in the previous week. The top three cryptocurrencies by market capitalization could continue to outperform, with bulls in control of the momentum.

Economic outlook 2026-2027 in advanced countries: Solidity test

After a year marked by global economic resilience and ending on a note of optimism, 2026 looks promising and could be a year of solid economic performance. In our baseline scenario, we expect most of the supportive factors at work in 2025 to continue to play a role in 2026.

Crypto market outlook for 2026

Year 2025 was volatile, as crypto often is.  Among positive catalysts were favourable regulatory changes in the U.S., rise of Digital Asset Treasuries (DAT), adoption of AI and tokenization of Real-World-Assets (RWA).