EUR/USD Analysis: ECB’s stimulus package to weigh on the next Fed’s decision

EUR/USD Current Price: 1.1065
- The ECB cut rates by 10 basis points, announced open-ended QE.
- US core inflation better-than-anticipated in August, up by 2.4% YoY.
- EUR/USD back to familiar ranges, but risk now skewed to the upside.
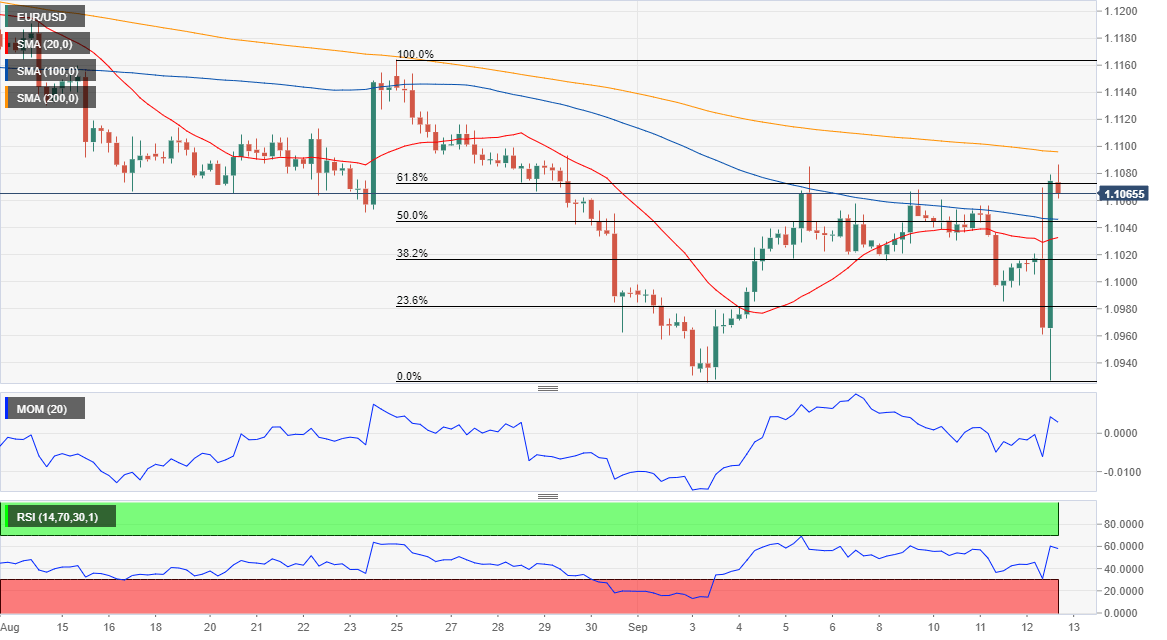
The EUR/USD pair collapsed to 1.0926 to later rally to 1.1086, as the ECB announced its latest monetary policy decision. The European Central Bank cut rates further into negative territory as expected, to -0.5%, adding an open-ended QE of €20 billion per month starting November 1st. Policymakers also introduced a reserve system that would exempt part of bank holdings from negative rates.
ECB stimulus package puts pressure on the Fed
The stimulus package came as underlying inflation remained generally muted, and the risks surrounding growth outlook remain tilted to the downside, according to Draghi’s words. European growth and inflation forecast were downwardly revised. The pair rebounded sharply from yearly lows and soared to fresh weekly highs, as ECB’s news boosted equities and government bond yields, but also put pressure on the US Federal Reserve, as the American Central Bank is now expected to cut rates next week. Meanwhile, the US released initial jobless claims for the week ended September 6, which resulted at 204K, better than the 215K expected. Inflation in the country was up by 0.3% monthly basis and by 2.4% when compared to a year earlier, in August, net of food and energy prices.
This Friday, the US will release August Retail Sales, seen up by 0.2% monthly basis, and the preliminary Michigan Consumer Sentiment Index for September, seen recovering to 90.9 after the August disappointment of 89.8.
EUR/USD short-term technical outlook
The EUR/USD pair is holding on to gains in the 1.1060 price zone, trading just below the 61.8% retracement of its latest daily decline, at around 1.1075. The wide intraday range didn’t change much the picture, as the pair is currently trading at the upper end of its latest comfort zone. In the 4 hours chart, the pair is above its 20 and 100 SMA, which present modest bearish slopes, but below the 200 SMA, this last at around 1.1100. Technical indicators hold within positive levels, although losing their strong upward momentum. The pair would need to overcome 1.0984, last week high, to have chances of extending its gains further during the upcoming sessions.
Support levels: 1.1025 1.0980 1.0955
Resistance levels: 1.1085 1.1120 1.1160
Author

Valeria Bednarik
FXStreet
Valeria Bednarik was born and lives in Buenos Aires, Argentina. Her passion for math and numbers pushed her into studying economics in her younger years.

















