EUR/USD analysis: bullish extension becoming more likely this week

EUR/USD Current price: 1.0796
The American dollar closed the week mixed, down against most of its major rivals, but those related to commodities, as speculative interest focused last week in unwinding the so-called "Trump-trade." Equities in the US had their worst week since last September, extending their early week decline on Friday after the US President Trump Obamacare repeal bill was pulled back by Republicans, after failing to gather enough support from the Congress. Trump made a quick statement in the Oval Office afterwards, announcing that his party will probably work on the tax reform now, which partially offset dollar and equities' decline. The EUR/USD pair closed the week around 1.0800, not far from this year high of 1.0828.
In the data front the week was quite light, with March preliminary Markit PMIs taking center stage. In Europe, estimated for the current month beat expectations and final February figures, indicating that the strong pace of growth in the region seen late 2016 continues to accelerate. According to the official report, the Eurozone economic growth reached a six-year high, with the Composite PMI up to 56.7 from 56.0 in the previous month. On the contrary, the US private sector expanded at its slowest pace for six months in the US, as the Markit Composite PMI came in at 53.2, from 54.1 in February.
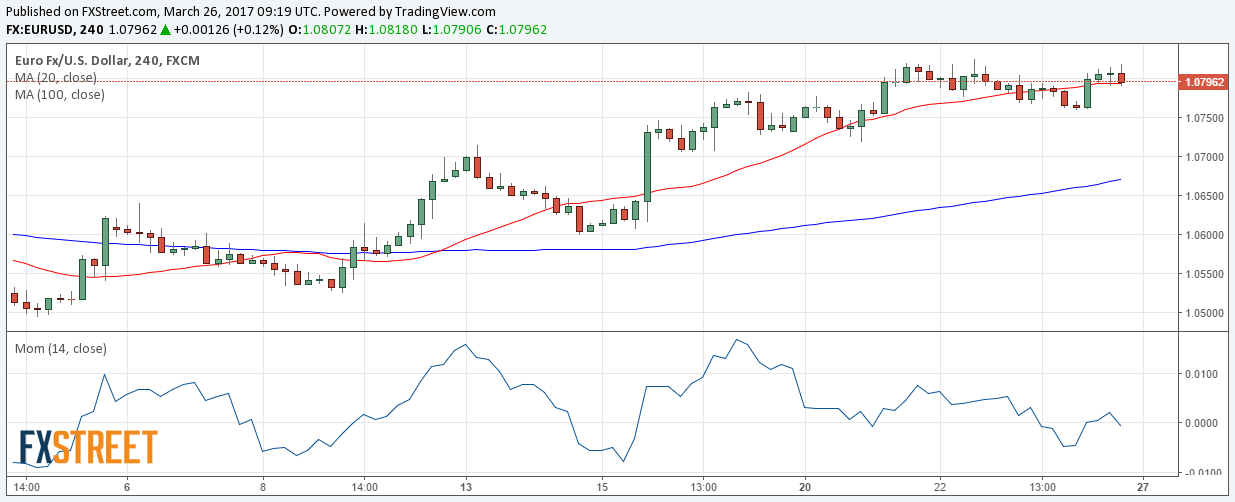
From a technical point of view, the EUR/USD pair has been contained by a major mid-term resistance, the 1.0820 level which represents the 50% retracement of the post-US election's decline, although pullbacks from the area have been quite shallow, which implies a high risk of a bullish breakout. In the daily chart, the Momentum indicator maintains its bullish slope, now within overbought territory, whilst the RSI indicator consolidates around 62, reflecting the latest range-bound trading. In the same chart, the 20 DMA heads north below the current level after crossing above the 100 DMA, all of which supports additional advances, particularly on an upward extension beyond the 1.0820/30 region. Shorter term, the 4 hours chart shows that the price has settled a few pips above a horizontal 20 SMA, whilst technical indicators lack directional strength, also reflecting the latest lack of directional strength rather than suggesting buying exhaustion.
Support levels: 1.0765 1.0730 1.0700
Resistance levels: 1.0830 1.0870 1.0910
Author

Valeria Bednarik
FXStreet
Valeria Bednarik was born and lives in Buenos Aires, Argentina. Her passion for math and numbers pushed her into studying economics in her younger years.


