EUR/USD analysis: at the upper end of the weekly range

EUR/USD Current price: 1.2382
- EU inflation disappointed, but dollar remains the weakest.
- EUR/USD faces a major resistance around 1.2410/20.
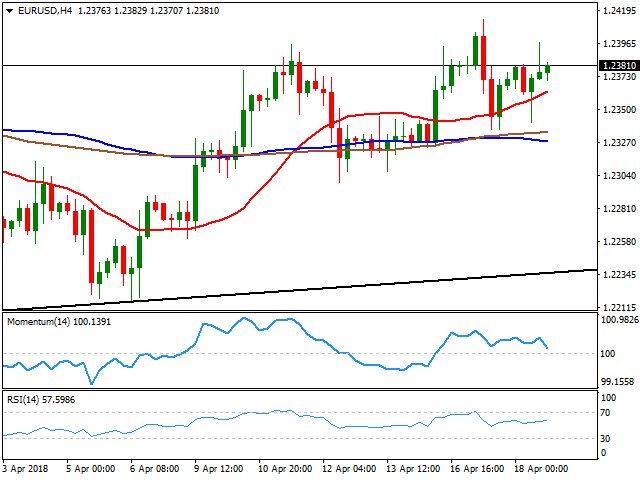
The EUR/USD pair recovered the ground lost Tuesday and neared again the 1.2400 figure, but remained below it as the latest EU CPI was a drag for the common currency. According to the official release, inflation was up 1.3% YoY in March, below the 1.4% expected, although the core readings came as expected, up 1.4% in the month and 1% YoY. Furthermore, Construction Output in the EU was down 0.5% in February, missing market's expectations of a 0.2% advance, while the YoY figure posted a shy 0.4% gain vs. the expected 2.3%. The pair posted a negative reaction to the release, moreover as UK inflation released a few minutes before was also discouraging and weighed on the Pound, but the dollar was unable to actually appreciate, and begun easing on self-weakness.
Equities struggled around their opening events both in Europe and the US, easing the previous strong momentum, probably also affecting demand for the American currency. This Thursday, the macroeconomic calendar will offer minor figures from both economies, as the EU will unveil February Current Account numbers, while the US will offer its usual weekly unemployment figures and the Philly manufacturing survey for April.
The pair is at the upper end of its weekly range, but still within familiar ranges and with no signs of clear directional strength. In the short term, and according to the 4 hours chart, the risk is skewed to the upside, as the pair develops above a bullish 20 SMA, which advances above the larger ones, while technical indicators hold within positive territory, albeit the Momentum having lost its upward strength, and the RSI now at 60, well below the peak reached when the price touched 1.2413 earlier this week. The 1.2410/20 region is a key resistance area that should be clearly broken to trigger additional gains ahead, as the pair topped around it multiple times over the last few weeks, and where now is the daily descendant trend line coming from this year high.
Support levels: 1.2370 1.2335 1.2295
Resistance levels: 1.2415 1.2445 1.2480
Author

Valeria Bednarik
FXStreet
Valeria Bednarik was born and lives in Buenos Aires, Argentina. Her passion for math and numbers pushed her into studying economics in her younger years.