EUR/USD analysis: at key technical juncture

EUR/USD Current price: 1.1814
The EUR/USD pair fell for a third consecutive week, ending it a 1.1814 and after trading as low as 1.1716. The common currency took a dive at the beginning of the week as a result of Angela Merkel's sour victory in the German election, which brought back concerns about rising anti-global populism within the EU. An upward corrective movement that begun on Thursday was fueled on Friday by soft US data, as the Fed's favorite inflation measure, the core PCE index for August missed market's expectations. Consumer inflation rose by 0.1% in the month, matching July's reading, but below forecast of 0.2%, while when compared to a year earlier, it came in at 1.4%, below the expected 1.5%. Also, the University of Michigan’s Index of Consumer Sentiment fell 1.7 points in September to 95.1, on concerns about the economic consequences of the latest hurricanes that hit the US. Limiting EUR's advance was worst-than-expected inflation in the area, as preliminary September estimate fell to 1.1% YoY from previous 1.3%.
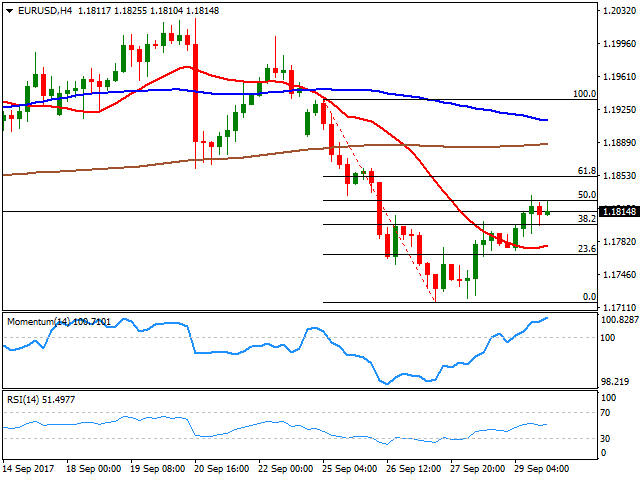
The pair's decline seems still corrective in the long-term, as it´s down around 300 pips after rising roughly 1500 pretty much straight since bottoming around 1.0600 last April, and despite the latest recovery, it could extend during the upcoming days, as the pair was unable to recover beyond August bottom in the 1.1820/30 price zone. In the daily chart, technical indicators have bounced from near oversold levels, but remain within bearish territory, indicating that selling interest is limited, although the price is well below a bearish 20 SMA, around 1.1920. The pair managed to correct half of its weekly losses, with the 50% retracement of the decline at 1.1825, converging with the mentioned lows. In the 4 hours chart, the pair presents an upward potential yet to be confirmed, as the price recovered above a now flat 20 SMA, the RSI indicator holds directionless around its mid-line, and the Momentum indicator aims north near overbought levels.
Support levels: 1.1765 1.1720 1.1690
Resistance levels: 1.1830 1.1870 1.1920
Author

Valeria Bednarik
FXStreet
Valeria Bednarik was born and lives in Buenos Aires, Argentina. Her passion for math and numbers pushed her into studying economics in her younger years.


