EUR/USD: A big round number is in play
EUR/USD has been bearish upon a Double Top. The price may have found a level of resistance, which is a huge round number. Thus, the price action around the level may become very vital. Yesterday's daily candle came out as an engulfing candle, which states that the sellers are confident in holding their short positions. As of writing, today's intraday price action has been choppy. Let us find out what the daily, the H4, and the H1 chart suggest.
Chart 1 EUR/USD Daily Chart
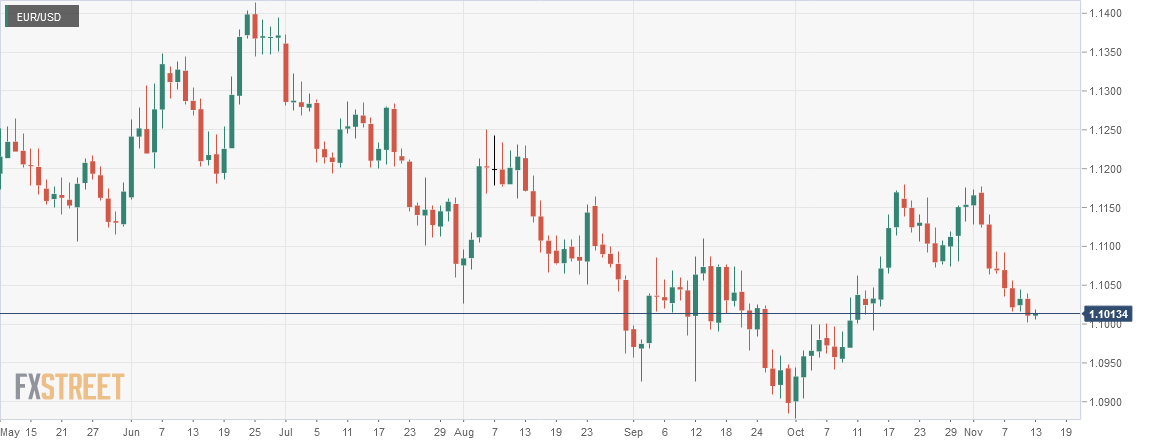
The chart shows that it formed a daily engulfing candle right at the resistance of a Double Top. The price has been heading towards the South with good bearish momentum. On its way, it breached the neckline. However, the neckline breakout has not added more selling pressure. It may have been because the level of 1.1000 is a huge round number is not too far down from the neckline level. However, yesterday's engulfing candle may attract the sellers to go short on the pair, which eventually helps the pair make the breakout the level of 1.1000.
Chart 2 EUR/USD H4 Chart
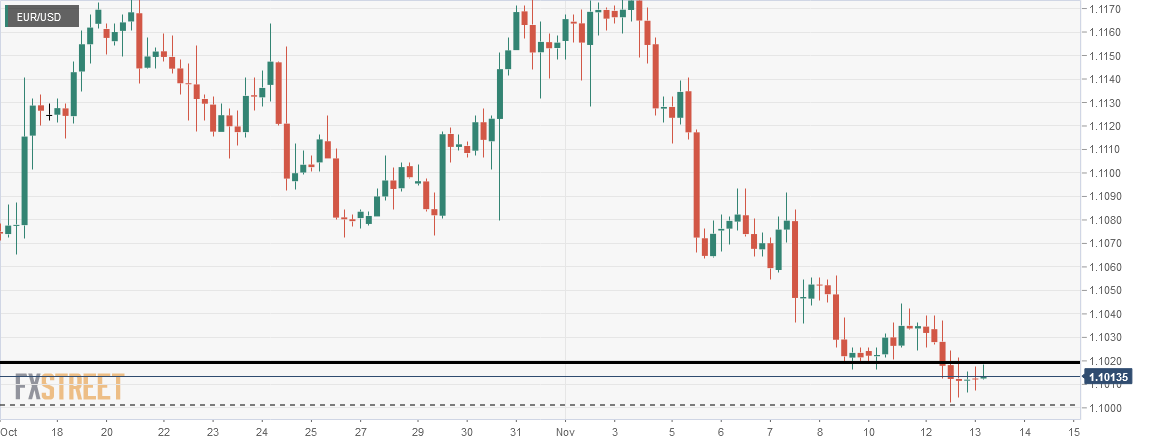
The H4 chart shows that the price made a breakout at the level of 1.1020. After having a bounce at the big round number, it has been roaming around the breakout level. The level has the potential to hold the price and produce a bearish reversal candle. If that happens, then an H4 breakout at the level of 1.1000 may attract the sellers to go short and drive the price towards the South further. The fact remains; the support is too big a number, the H4 sellers might come out with their profit after the breakout. This may make the price make an abrupt upward movement on the H4 chart.
Chart 3 EUR/USD H1 Chart
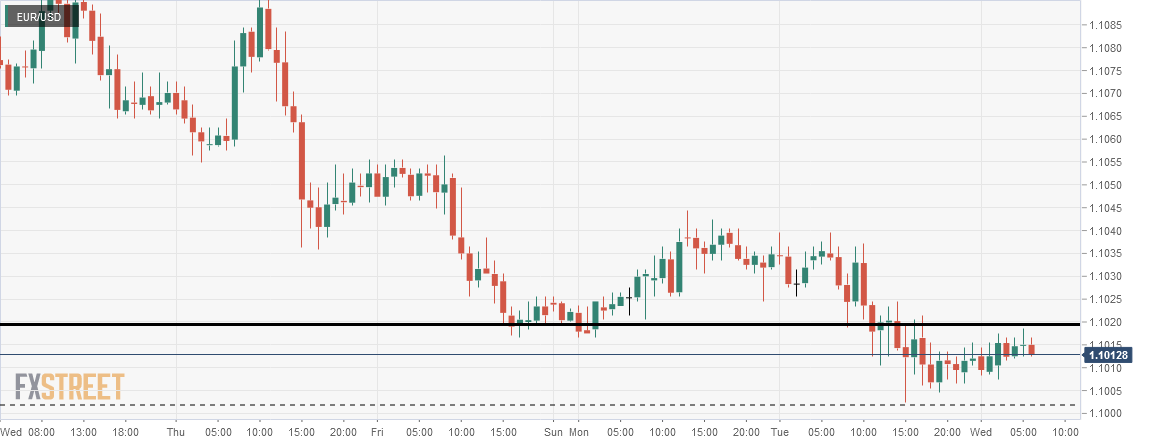
The H1 chart looks choppy. The price has been on an upward correction. However, the last bearish wave does not look good either. The H1 sellers were not confident to drive the price towards the downside. Thus, it had several pauses. Nevertheless, it made a breakout at the level of 1.1020, where the price had its support earlier. The level may hold the price as flipped resistance and produce a bearish reversal candle to make a breakout at the level of 1.1000.
The charts above suggest that the sellers have the upper hand. A bearish momentum shall get them engaged in selling. The buyers, however, have to wait to get a strong bullish reversal candle. They may have to wait, but they have reason to be hopeful since a big round number is in play.
Author

EagleFX Team
EagleFX
EagleFX Team is an international group of market analysts with skills in fundamental and technical analysis, applying several methods to assess the state and likelihood of price movements on Forex, Commodities, Indices, Metals and


