EUR/NZD: The bear is slightly ahead than the bull

EURNZD: has been heading towards the south on the daily chart. The price made a strong bullish move on the daily chart. It seems that the price has been on bearish correction on the daily chart. Yesterday’s candle came out as a strong bearish candle. Thus, the major intraday charts look slightly good for the bear. Let us have a look at those three charts.
EUR/NZD Daily Chart
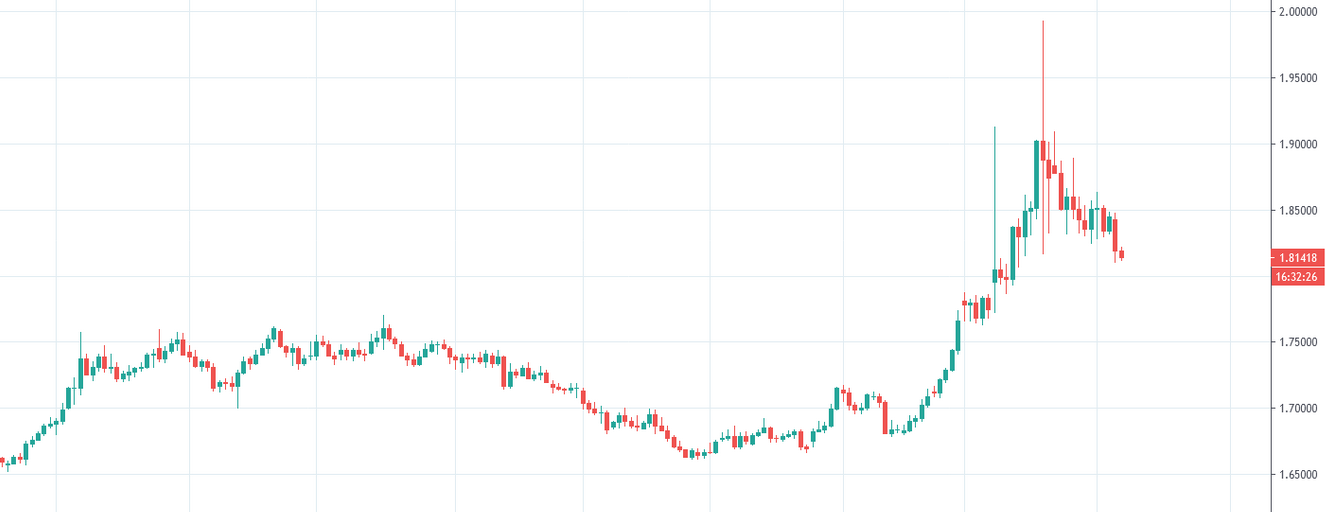
The chart shows that the price has been heading towards the south at a moderate pace. Considering the last bullish move, the 38.2% level is still intact. However, yesterday’s candle came out as a bearish engulfing candle after an inside bar bullish candle. Thus, the sellers may go short below yesterday’s lowest low. The price may find its next support at the level of 1.76700.
EUR/NZD H4 Chart
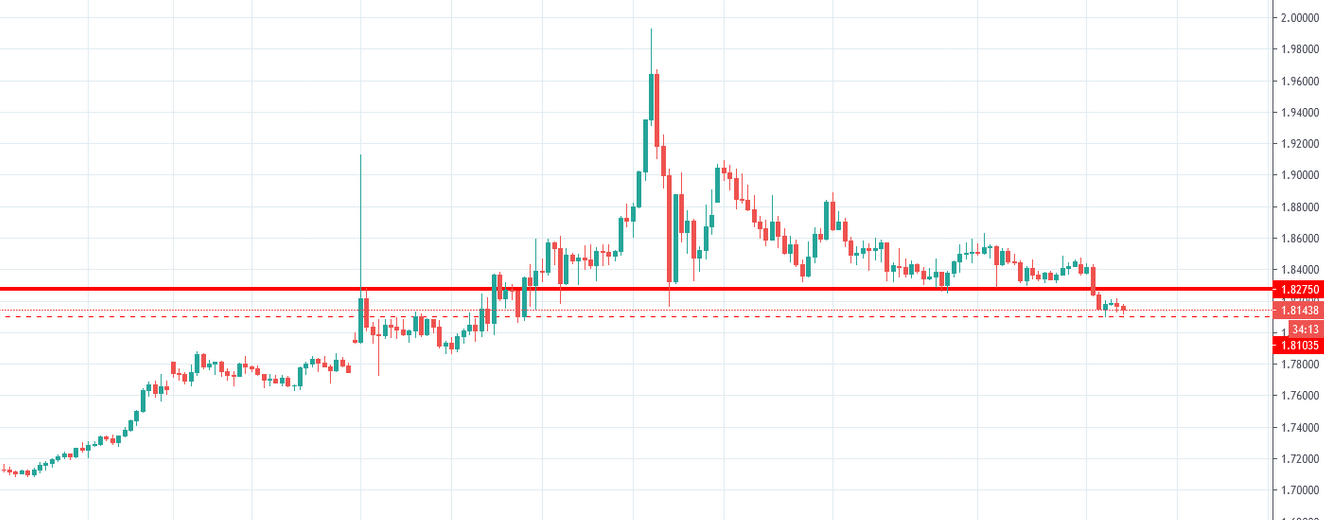
The price made a strong bearish move. Then, it has been choppy for quite a while. It made a breakout at 1.82750 yesterday. The price has had consolidation around the level of 1.81035. The sellers may want to wait for a deep consolidation before going short in the pair. The level of 1.82750 may come as the level of resistance. If the level produces a bearish reversal candle, the sellers may drive the price towards the south upon a breakout at 1.81035. The price may find its next support at around 1.77000.
EUR/NZD H1 Chart
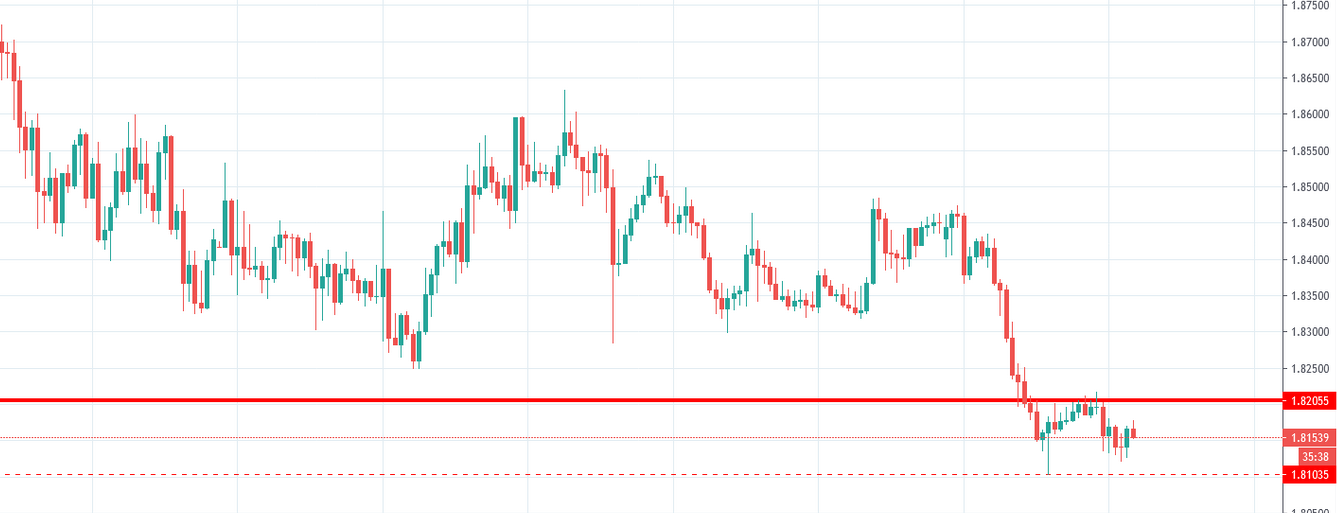
The H1 chart looks good for the bear. The price after making a strong bearish move had a bounce at the level of 1.81035. It headed towards the upside and consolidated around the level of 1.82055. At that level, the price has already produced a bearish engulfing candle. If the price heads down and makes a breakout at the level of 1.81035, the sellers may go short in the pair and drive the price towards the south further. The pair may find its next support at around 1.78825. On the other hand, if the level of 1.81035 works as a support level and pushes the price upwards, a breakout at the 1.82055 level may push the price towards the North. It may create good bullish momentum since it would be considered as neckline breakout of a double bottom.
The daily and the H1 chart look good for the bear. The H4 chart needs time to get bearish. Considering these three charts, it seems that the pair may have another bearish day today.
Author

EagleFX Team
EagleFX
EagleFX Team is an international group of market analysts with skills in fundamental and technical analysis, applying several methods to assess the state and likelihood of price movements on Forex, Commodities, Indices, Metals and


