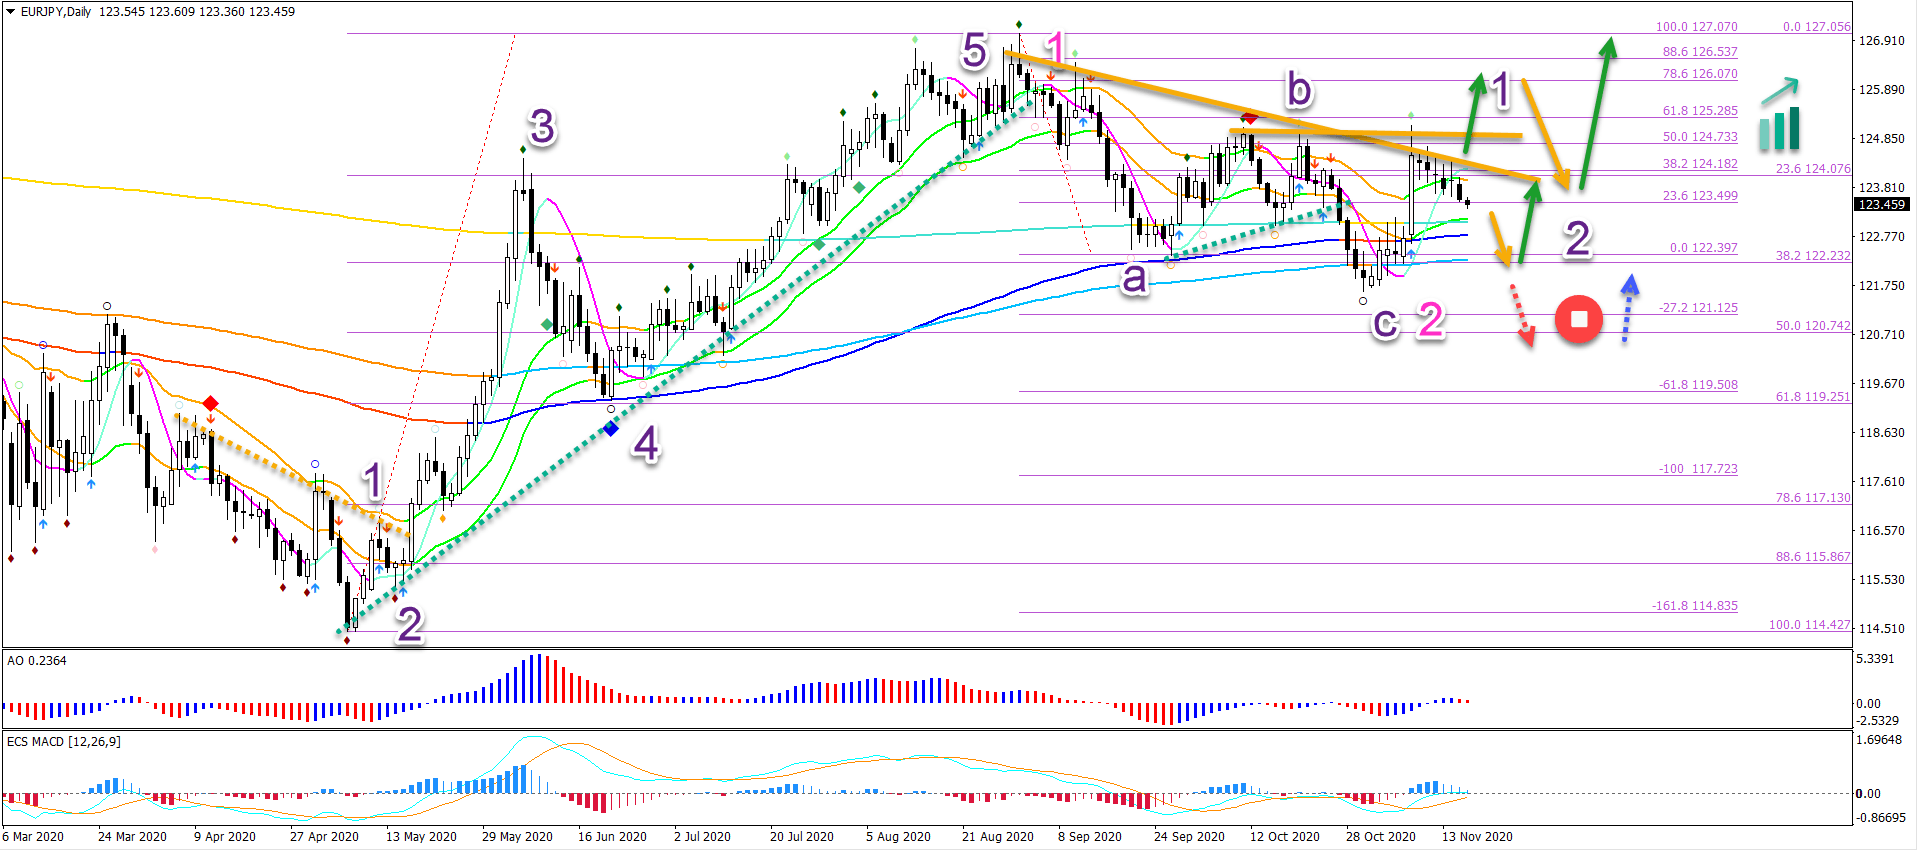
EUR/JPY decision zone at 50% fib at 123.40
-
The EUR/JPY has reached a decisive support zone. The break or bounce moment will offer traders an interesting spot for trade setups.
-
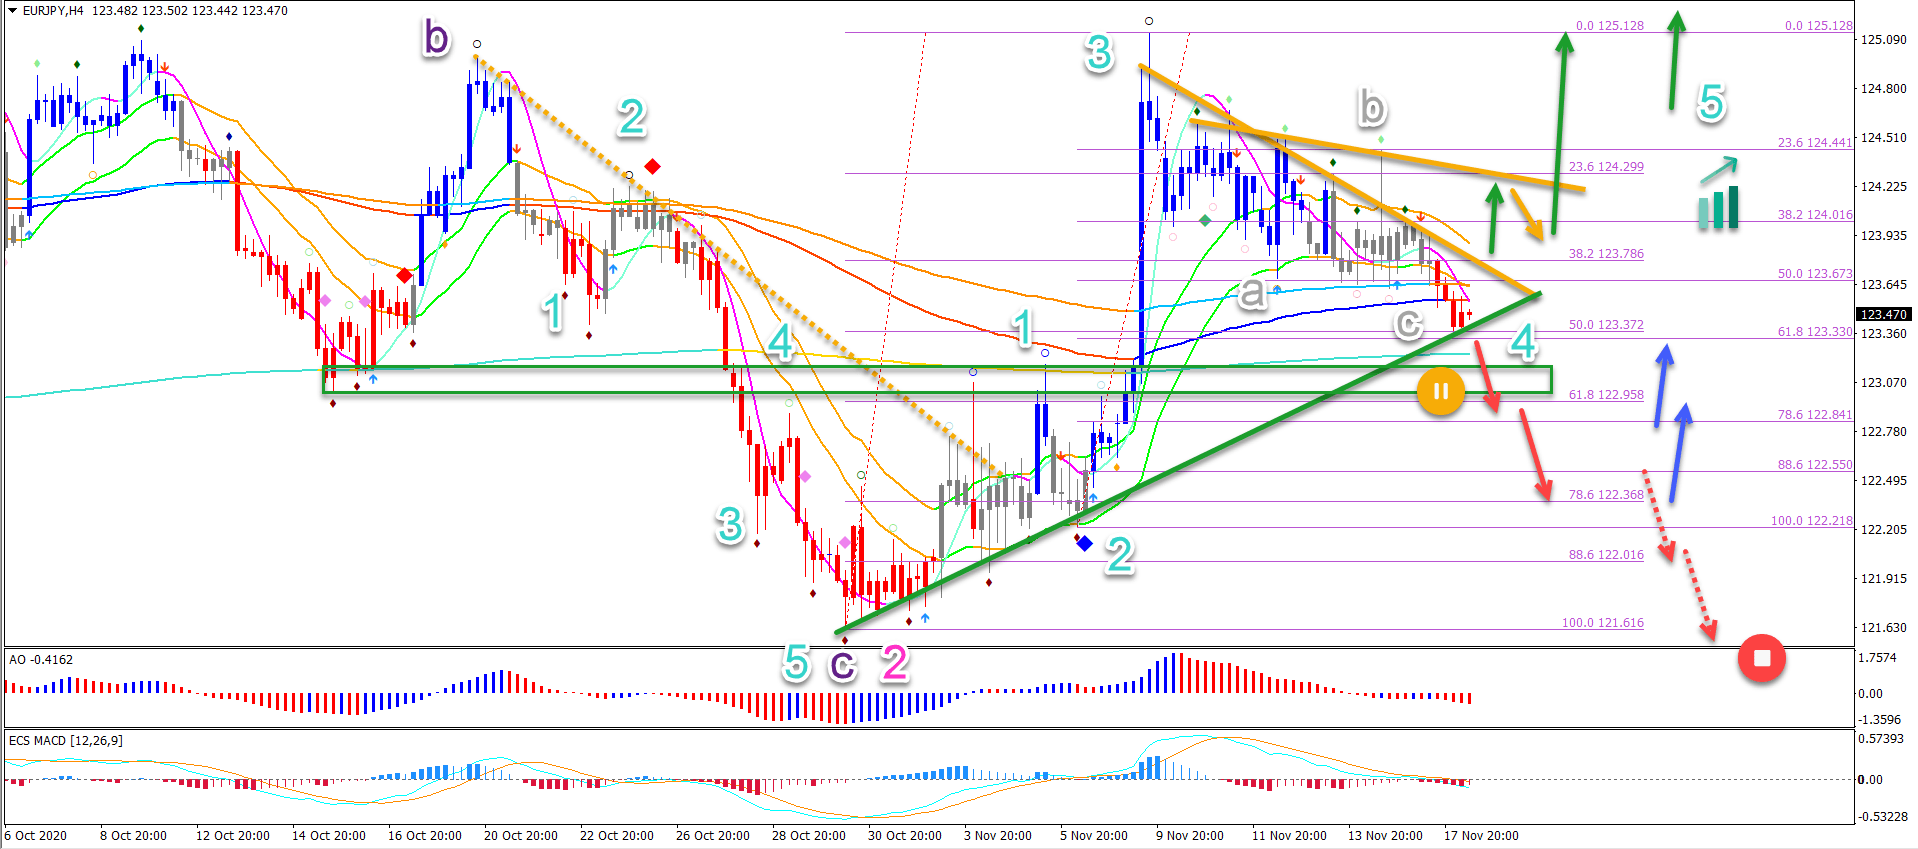
On the 4 hour chart, price action has reached the last support zone if the current pullback is a wave 4 (blue).

This article reviews the potential breakouts, wave patterns, and chart patterns.
Price Charts and Technical Analysis
The EUR/JPY is testing the resistance trend lines and 21 ema zone:
-
A bullish breakout confirms the uptrend in wave 1 or 3 (purple).
-
A deeper bearish pullback could indicate a wave 1-2 (purple).
A bullish break is expected to develop as follows:
-
It could see a break, pullback and continuation pattern.
-
A bullish daily candlestick should confirm the bullish break.
-
This is valid as long as the bullish candle appears in about the next 5 trading days (the HMA 20 should remain above the 21 ema high).
A bearish pullback could see two variations:
-
A test and bounce at the 144 ema for a wave 1-2 (purple).
-
A bearish breakout (red dotted arrow) which invalidates (red circle) this wave pattern but not the entire uptrend because the 50% and 61.8% Fib remain support.
On the 4 hour chart, price action has reached the last support zone if the current pullback is a wave 4 (blue). A deeper bearish breakout (yellow circle) indicates a wave 1-2 pattern instead. A full break below the bottom (red circle) invalidates the bullish outlook.
However, if price action manages to:
-
Break above the 21 ema zone.
-
And break above the resistance trend line.
-
Then the EUR/JPY would confirm the development wave 5 to the upside.
The analysis has been done with the ecs.SWAT method and ebook.
Author

Chris Svorcik
Elite CurrenSea
Experience Chris Svorcik has co-founded Elite CurrenSea in 2014 together with Nenad Kerkez, aka Tarantula FX. Chris is a technical analyst, wave analyst, trader, writer, educator, webinar speaker, and seminar speaker of the financial markets.


