EUR/CHF: the Bear Seems Stronger than the Bull

EUR/CHF produced a strong bearish daily candle yesterday. The price has kept making lower lows on the daily chart. Today’s price action suggests that the price has been having a correction. If it finds its resistance and makes a breakout at yesterday’s lowest low, the pair may end up producing another bearish candle on the daily chart.
Chart 1 EUR/CHF Daily Chart
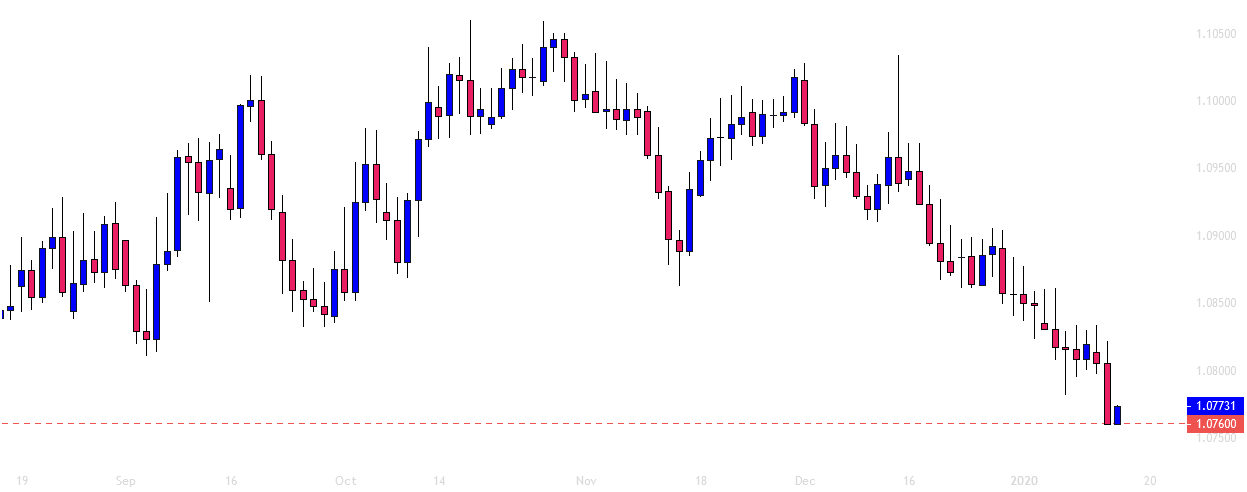
The daily chart shows that the price has been heading towards the South for quite a few days. Yesterday’s bearish candle closed at the level of 1.07600. Usually, the price produces a corrective candle after such a move. However, if the price makes a breakout at the lowest low of the last day's candle on the major intraday charts, it keeps heading towards the trend's direction. Let us now have a look at two major intraday charts.
Chart 2 EUR/CHF H4 Chart
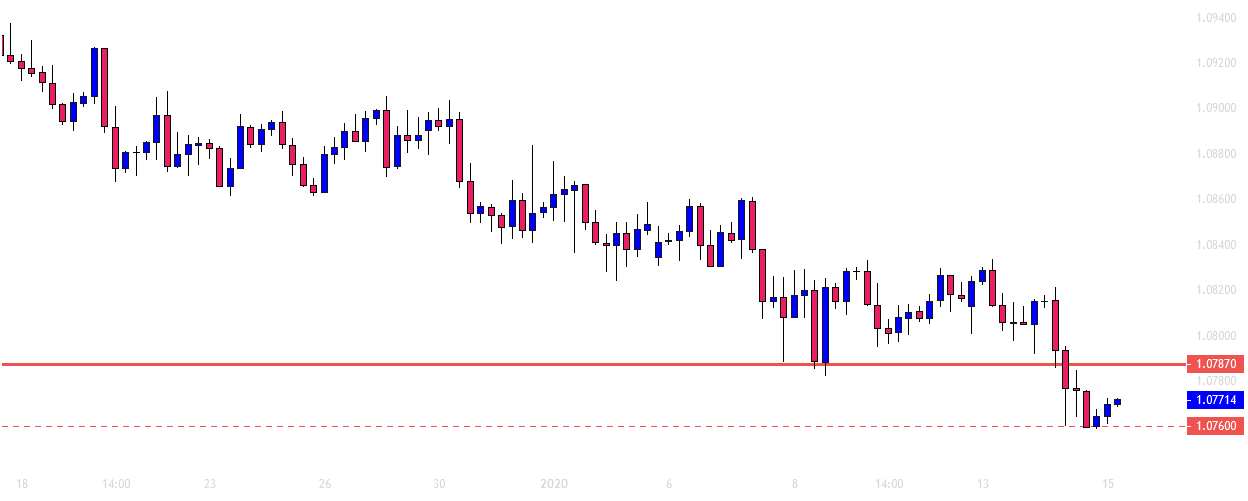
The chart shows that the price after being very bearish has found its support at the level of 1.07600. It has produced two consecutive bullish candles. The body of those candles suggests that the price has been searching for its resistance. The level of 1.07870 may work as the level of resistance since the price had reacted at this level earlier. If the level produces a bearish reversal candle followed by a breakout at the level of 1.07600, the sellers may drive the price towards the South further. The price may find its next support at the level of 1.07090. On the other hand, if the price breaches the level of 1.07870, the H4 chart may get choppy for a while.
Chart 3 EUR/CHF H1 Chart
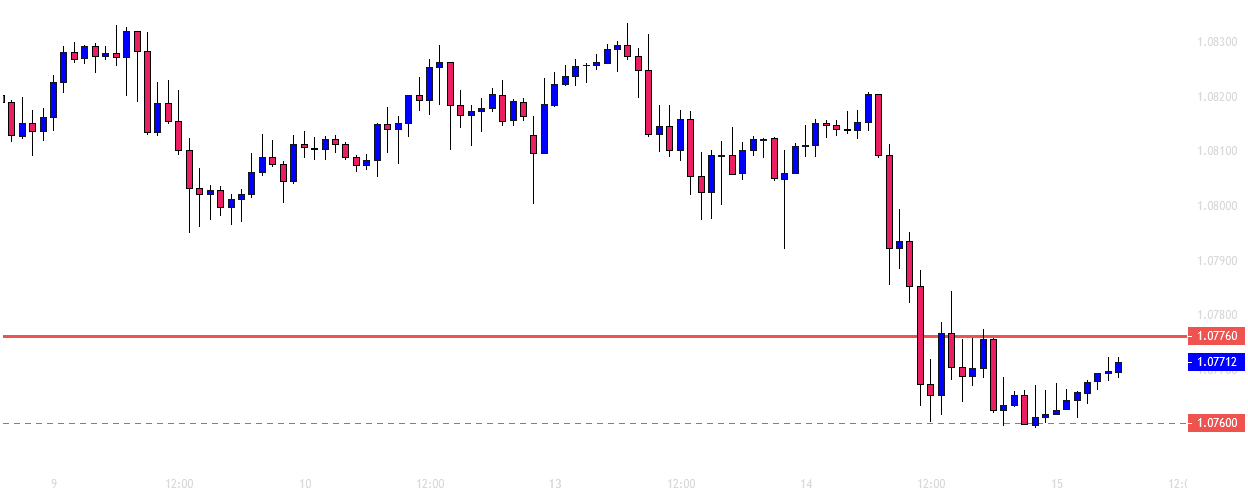
The H1 chart shows that the price has been heading towards the North slowly. The level of 1.07760 may work as the level of resistance on the H1 chart. The sellers are to wait for the level to produce a bearish reversal candle followed by a breakout at the level of 1.07600 to go short on the pair. In this case, the price may find its next support at the level of 1.07310. If the price breaches the level of 1.07760, the buyers may find an opportunity to go long on the pair. The level of 1.08000 may be the resistance if the price heads towards the North.
Since the daily chart is bearish biased, the pair may end up having another strong bearish day today. If the price keeps having an upward correction, the H1 buyers may go long and make it be a bullish day. However, the bull may not produce that strong momentum comparing to the bear.
Author

EagleFX Team
EagleFX
EagleFX Team is an international group of market analysts with skills in fundamental and technical analysis, applying several methods to assess the state and likelihood of price movements on Forex, Commodities, Indices, Metals and


