EUR/CAD: Neutral but may get bullish
EUR/CAD has been choppy in the daily chart. The pair produced a bullish engulfing candle yesterday. Thus, major intraday charts’ traders may look to go long in the pair. The price has been in a bearish correction on the major intraday charts, such as the H4 and the H1. The price is roaming around a flipped level of support on the respective charts. The buyers are to wait for the EURCAD to produce a bullish reversal candle followed by a bullish breakout at yesterday's highest high to push the price towards the North. Let us have a glance at those three charts.
EUR/CAD Daily Chart
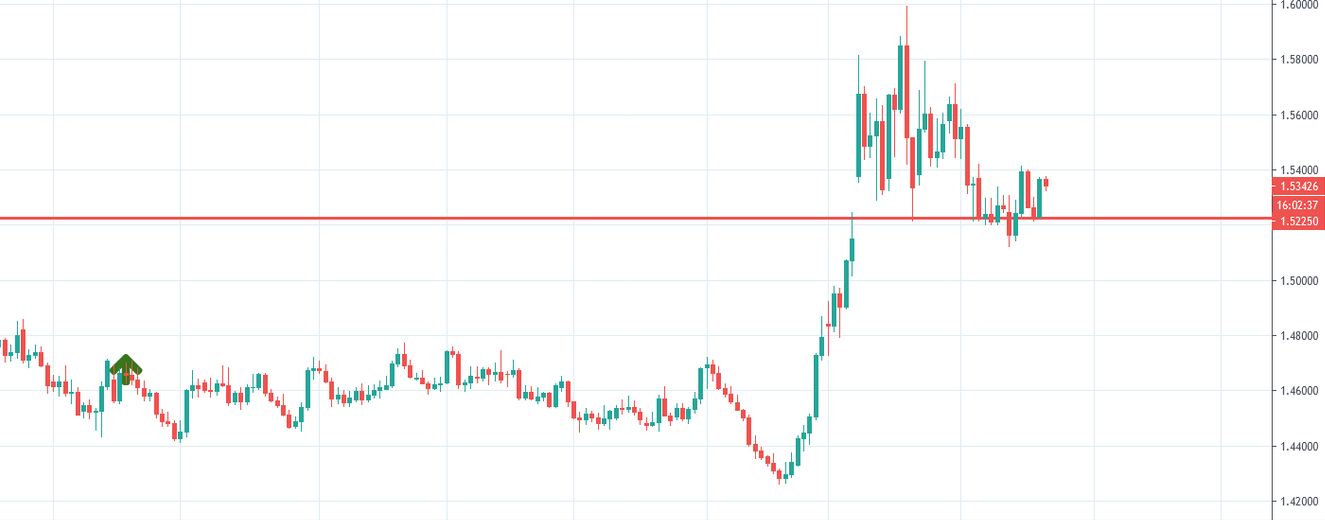
The chart shows that the price gets caught and roam around within two levels for some trading days. The level of 1.52250 has been working as a level of support. A daily bearish candle closed below the level, but the next candle came out as a bullish candle, and the price came back in. Yesterday, the chart produced a bullish engulfing candle. The daily traders must wait to find a direction. However, the H4 and the H1 traders may be able to find out long opportunities in the pair.
EUR/CAD H4 Chart
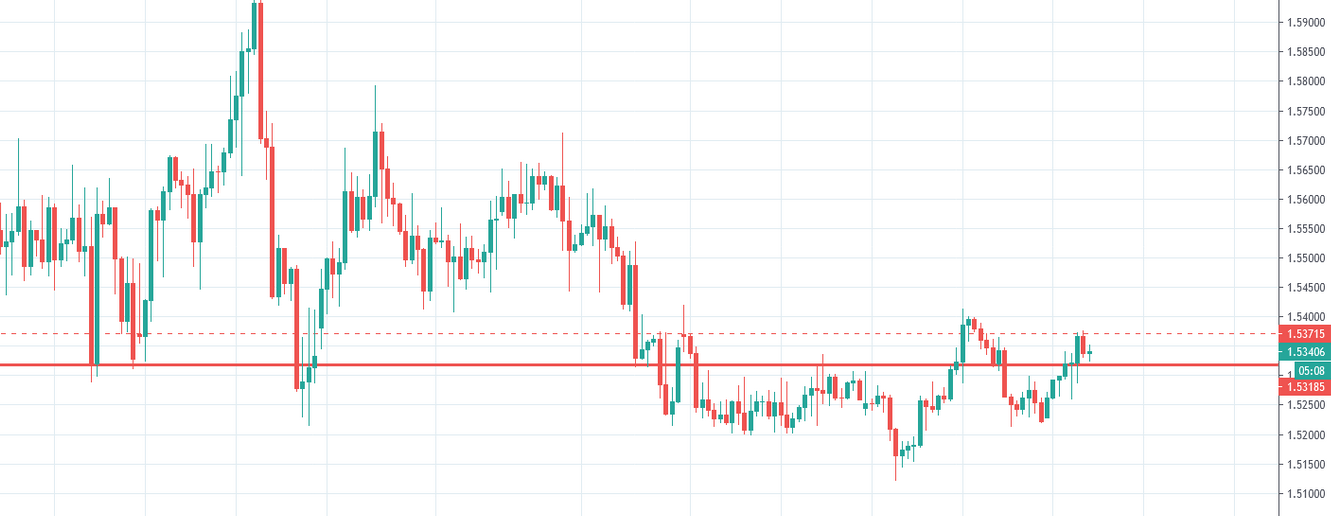
The chart shows that EURCAD made a bullish move upon producing a double bottom. It found its resistance at 1.53715 and produced a bearish inside bar. The level of 1.53185 may act as a level of support. If this level produces a bullish reversal candle, the buyers may go long above the level of 1.53715. The price may find its next resistance around 1.54600. On the other hand, if the price makes a bearish breakout at 1.53185, it may get more sluggish and make traders wait to find the next direction.
EUR/CAD H1 Chart
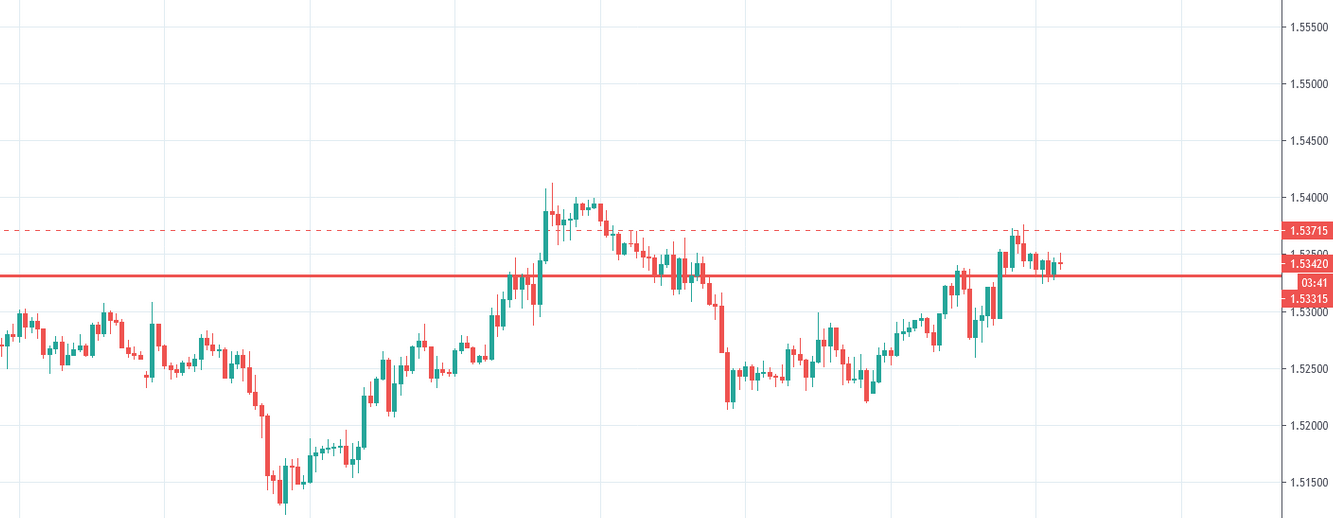
The chart shows that the price has made a bullish move at a moderate pace. Upon finding its resistance at 1.53715, it has been bearish. The pair is roaming around 1.53315, which is a flipped support. The level already produces a bullish reversal candle. If the price heads up and makes a breakout at 1.53715, the buyers may go long above the level of 1.53315. The price could find its next resistance at 1.54100. In case of a bearish breakout, it may find its next support at 1.52900.
Considering three charts, it seems that the buyers may have an upper hand on the H4 and H1 chart. They are to wait for the price to produce a bullish momentum and a breakout at yesterday's highest high, though.
Author

EagleFX Team
EagleFX
EagleFX Team is an international group of market analysts with skills in fundamental and technical analysis, applying several methods to assess the state and likelihood of price movements on Forex, Commodities, Indices, Metals and


