|

EUR/CAD bounces back: Reaction higher from blue box area

In this technical blog, we will look at the past performance of the 1-hour Elliott Wave Charts of EURCAD. In which, the rally from 02 September 2025 low unfolded as impulse sequence & showed a higher high sequence therefore, called for an extension higher to take place. We knew that the structure in EURCAD should remain supported & extend higher. So, we advised members not to sell the pair & buy the dips in 3, 7, or 11 swings at the blue box areas. We will explain the structure & forecast below:

EUR/CAD one-hour Elliott Wave chart from 9.19.2025

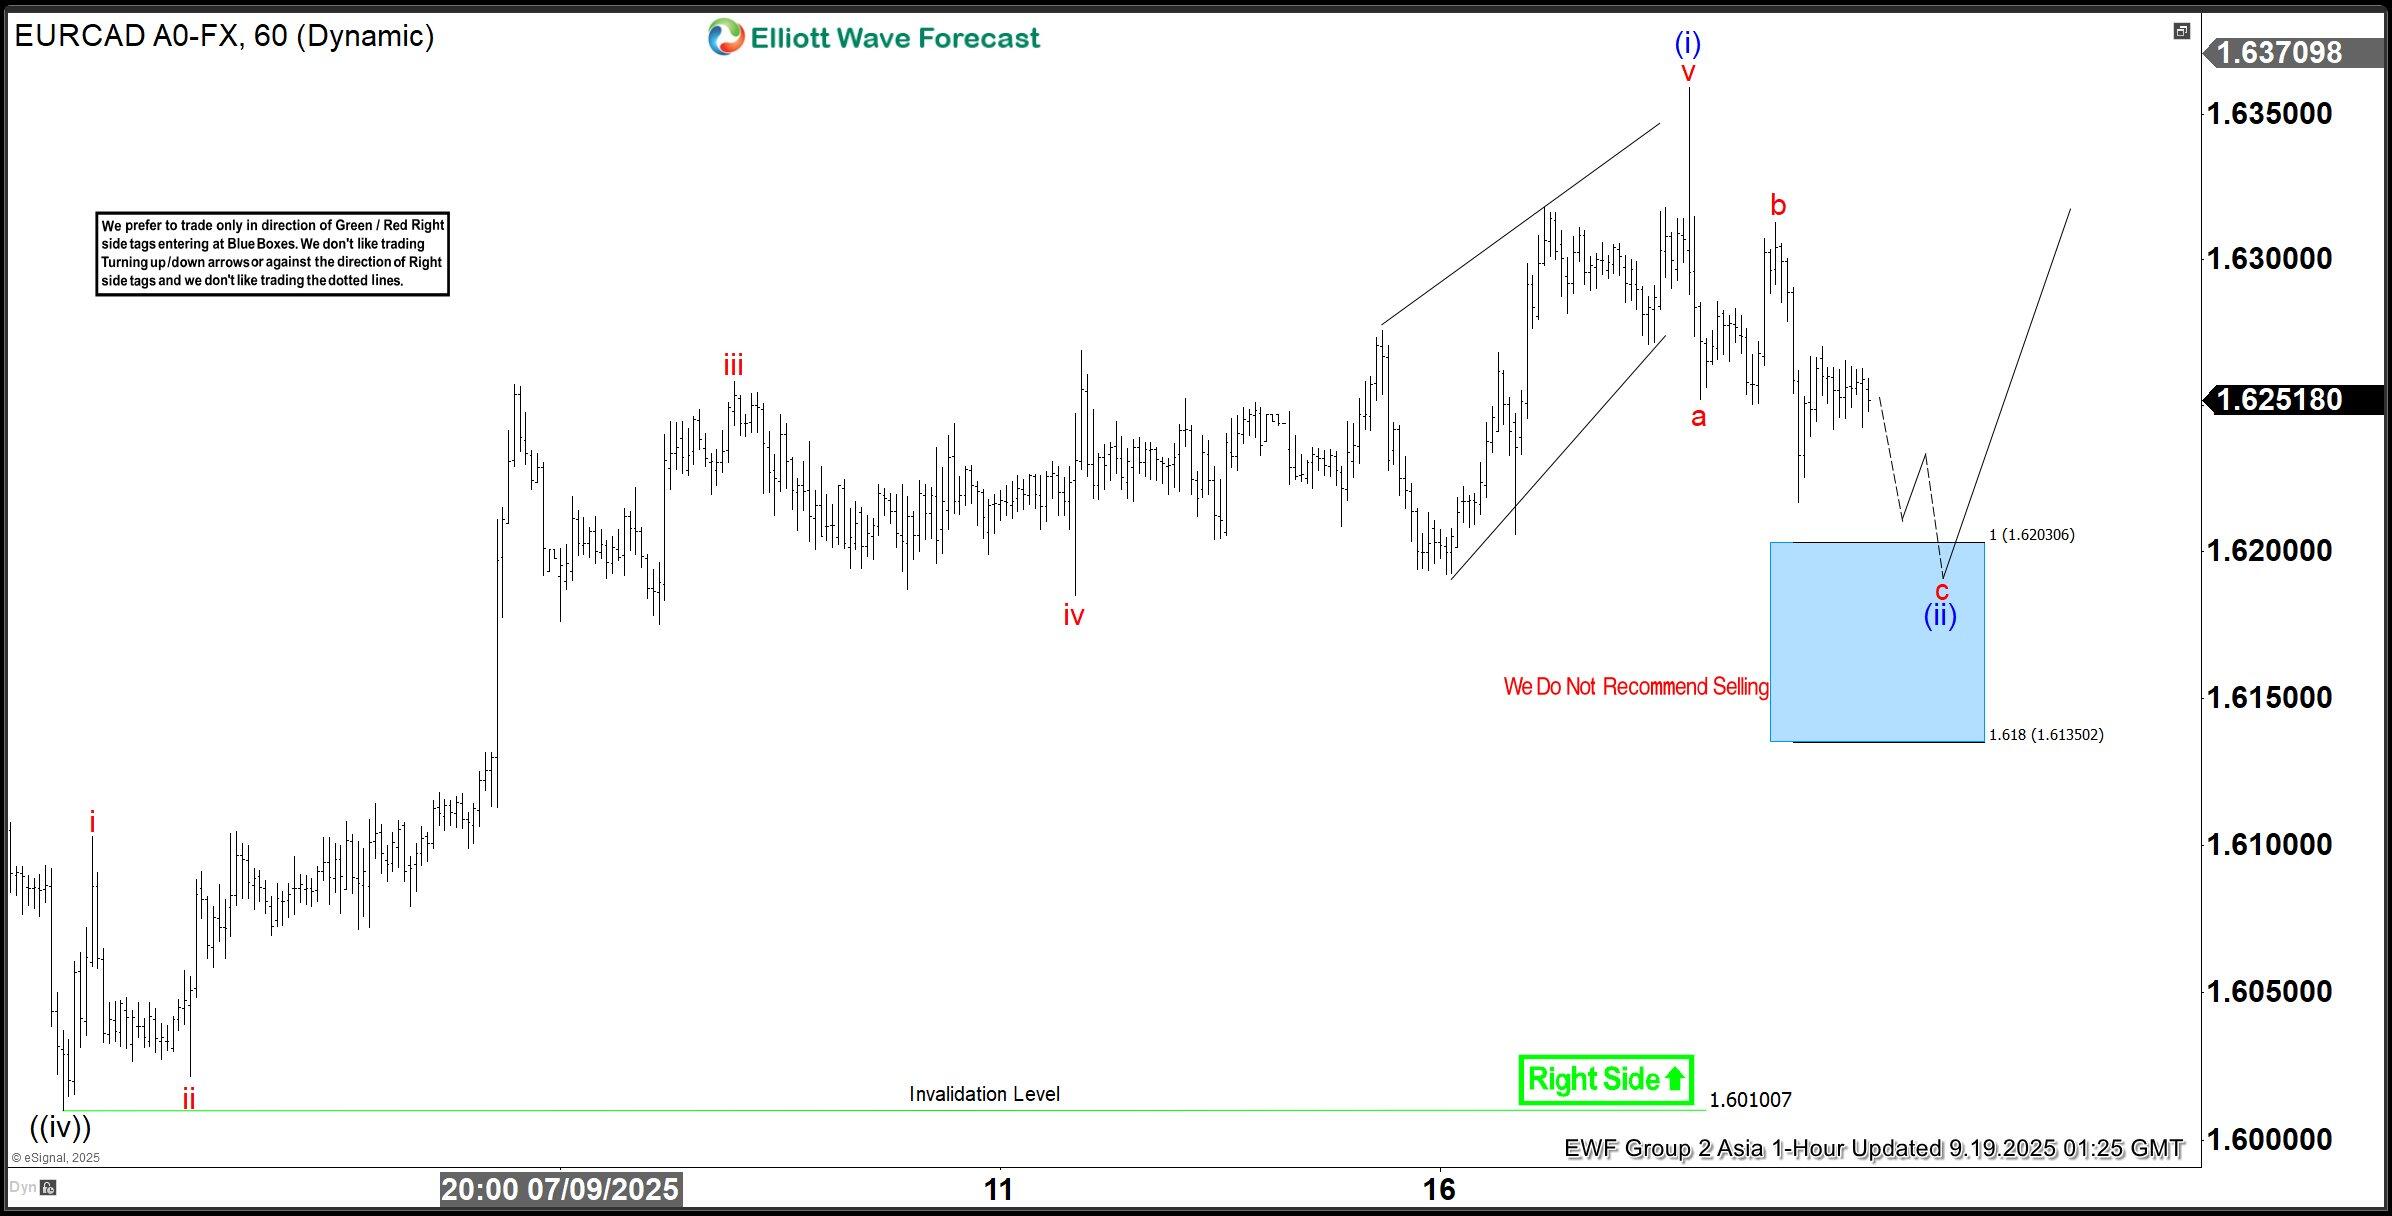
Here’s the 1-hour Elliott wave Chart from the 9.19.2025 Asia update. In which, the rally to 1.6359 high completed small wave (i) & made a pullback in wave (ii). The internals of that pullback unfolded as Elliott wave zigzag correction where small wave a ended at 1.6258 low. Then small bounce to 1.6313 high-ended small wave b. Then started the next leg lower in wave c towards 0.6203- 1.6135 blue box area. From there, buyers were expected to appear looking for new highs ideally or for a 3-wave bounce minimum.

EUR/CAD latest one-hour Elliott Wave chart from 9.29.2025

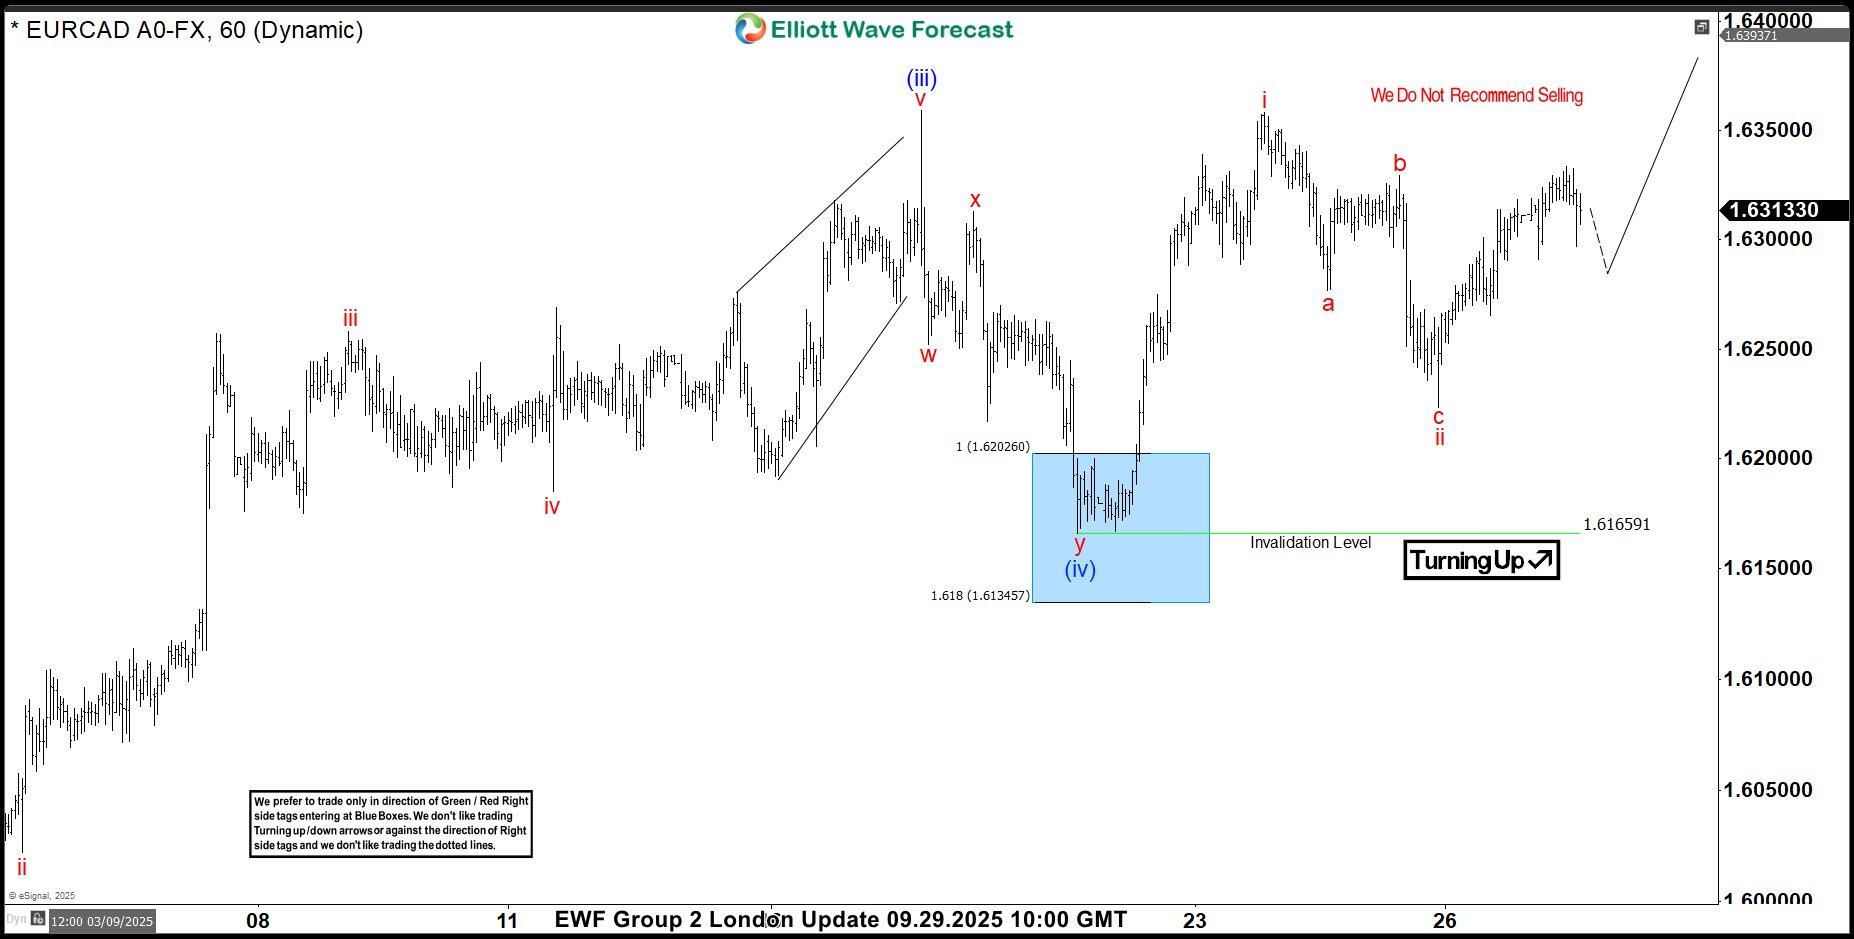
This is the latest 1-hour Elliott wave Chart from the 9.29.2025 London update. In which the pair is showing a strong reaction higher taking place, right after ending the correction within the blue box area. Allowed members to create a risk-free position shortly after taking the long position at the blue box area. However, a break above 1.6359 high is needed to confirm the next extension higher towards 1.6404- 1.6476 area minimum & avoid double correction lower.

Author

Elliott Wave Forecast Team

Elliott Wave Forecast Team

ElliottWave-Forecast.com

More from Elliott Wave Forecast Team
Share:

Editor's Picks

EUR/USD flirts with daily highs, retargets 1.1900

EUR/USD regains upside traction, returning to the 1.1880 zone and refocusing its attention to the key 1.1900 barrier. The pair’s slight gains comes against the backdrop of a humble decline in the US Dollar as investors continue to assess the latest US CPI readings and the potential Fed’s rate path.

GBP/USD remains well bid around 1.3650

GBP/USD maintains its upside momentum in place, hovering around daily highs near 1.3650 and setting aside part of the recent three-day drop. Cable’s improved sentiment comes on the back of the Greenback’s  irresolute price action, while recent hawkish comments from the BoE’s Pill also collaborate with the uptick.

Gold clings to gains just above $5,000/oz

Gold is reclaiming part of the ground lost on Wednesday’s marked decline, as bargain-hunters keep piling up and lifting prices past the key $5,000 per troy ounce. The precious metal’s move higher is also underpinned by the slight pullback in the US Dollar and declining US Treasury yields across the curve.

Crypto Today: Bitcoin, Ethereum, XRP in choppy price action, weighed down by falling institutional interest 

Bitcoin's upside remains largely constrained amid weak technicals and declining institutional interest. Ethereum trades sideways above $1,900 support with the upside capped below $2,000 amid ETF outflows.

Week ahead – Data blitz, Fed Minutes and RBNZ decision in the spotlight

US GDP and PCE inflation are main highlights, plus the Fed minutes. UK and Japan have busy calendars too with focus on CPI. Flash PMIs for February will also be doing the rounds. RBNZ meets, is unlikely to follow RBA’s hawkish path.

Ripple Price Forecast: XRP potential bottom could be in sight

Ripple edges up above the intraday low of $1.35 at the time of writing on Friday amid mixed price actions across the crypto market. The remittance token failed to hold support at $1.40 the previous day, reflecting risk-off sentiment amid a decline in retail and institutional sentiment.