EUR/AUD long-term bullish break aims at 1.69 target

The EUR/AUD broke above the long-term key resistance trend line (orange line). This could indicate a major bullish reversal.
4 hour chart
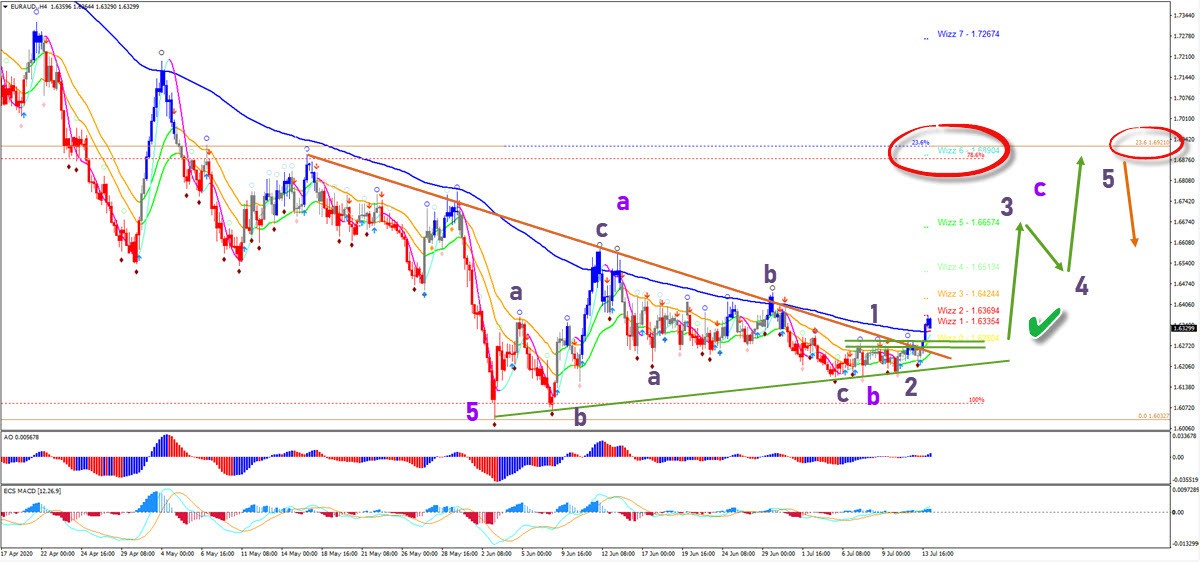
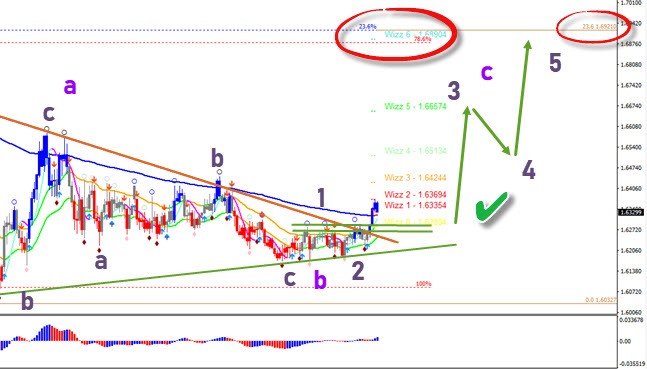
The EUR/AUD was unable to break below the 100% Fibonacci support. This bounce could complete a wave 5 (purple). Recently price has made several higher lows, which could be a finished wave B (purple). The current breakout is pushing above the 144 ema close as part of a potential wave 123 (light purple).
The EUR/AUD recent tops are potential support (green lines) and could act as a bouncing spot for a wave 3. A 5 wave pattern could take price up towards the main target zone at 1.69. The Fibonacci resistance could complete the bullish ABC and a downtrend could restart.
The analysis has been done with the ecs.SWAT method and ebook.
Author

Chris Svorcik
Elite CurrenSea
Experience Chris Svorcik has co-founded Elite CurrenSea in 2014 together with Nenad Kerkez, aka Tarantula FX. Chris is a technical analyst, wave analyst, trader, writer, educator, webinar speaker, and seminar speaker of the financial markets.


