|

Elliott wave view: Is gold bottom in place? [Video]

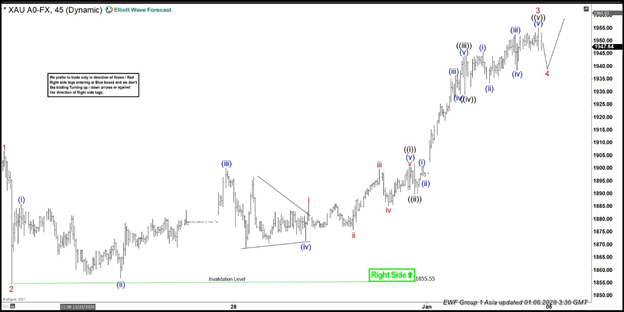
Since bottoming on December 1, 2020 low at $1764., Gold has steadily risen. Short Term Elliott Wave View suggests the rally from December 14, 2020 low is unfolding as a 5 waves impulse Elliott Wave structure. In the 45 minutes chart below, we can see wave 1 of this impulse ended at $1906.74 and dips in wave 2 ended at $1855.55. Up from there, wave ((i)) ended at $1900.56 as 5 waves impulse in lesser degree. Dips in wave ((ii)) ended at $1893.90. Gold then rallied higher again in wave ((iii)) which ended $1943.80, then wave ((iv)) pullback ended at $1928.80.

Final leg wave ((v)) ended at $1955.32 and this completed wave 3 in higher degree. Wave 4 pullback is now in progress to correct cycle from December 21 low before the rally resumes. Potential target for wave 4 is 23.6 – 38.2% Fibonacci retracement of wave 3 which comes at $1916 – $1931. From this area, Gold may find support and resume higher again. As far as December 21 low pivot at $1855.55 low remains intact, expect dips to find support in 3, 7, or 11 swing for more upside.

XAU/USD 45 Minutes Elliott Wave Chart

XAU

Gold (XAU/USD) Elliott Wave Video

Author

Elliott Wave Forecast Team

Elliott Wave Forecast Team

ElliottWave-Forecast.com

More from Elliott Wave Forecast Team
Share:

Editor's Picks

EUR/USD bounces off lows, back to 1.1860

EUR/USD now manages to regain some balance, retesting the 1.1860-1.1870 band after bottoming out near 1.1830 following the US NFP data on Wednesday. The pair, in the meantime, remains on the defensive amid fresh upside traction surrounding the US Dollar.

GBP/USD rebounds to 1.3660, USD loses momentum

GBP/USD trades with decent gains in the 1.3660 region, regaining composure following the post-NFP knee-jerk toward the 1.3600 zone on Wednesday. Cable, in the meantime, should now shift its attention to key UK data due on Thursday, including preliminary GDP gauges.

Gold stays bid, still below $5,100

Gold keeps the bid tone well in place on Wednesday, retargeting the $5,100 zone per troy ounce on the back of humble gains in the US Dollar and firm US Treasury yields across the curve. Moving forward, the yellow metal’s next test will come from the release of US CPI figures on Friday.

Ripple Price Forecast: XRP sell-side pressure intensifies despite surge in addresses transacting on-chain 

Ripple (XRP) is edging lower around $1.36 at the time of writing on Wednesday, weighed down by low retail interest and macroeconomic uncertainty, which is accelerating risk-off sentiment.

US jobs data surprises to the upside, boosts stocks but pushes back Fed rate cut expectations

This was an unusual payrolls report for two reasons. Firstly, because it was released on  Wednesday, and secondly, because it included the 2025 revisions alongside the January NFP figure.

XRP sell-off deepens amid weak retail interest, risk-off sentiment

Ripple (XRP) is edging lower around $1.36 at the time of writing on Wednesday, weighed down by low retail interest and macroeconomic uncertainty, which is accelerating risk-off sentiment.