|

Elliott Wave view in EUR/GBP calling for more downside [Video]

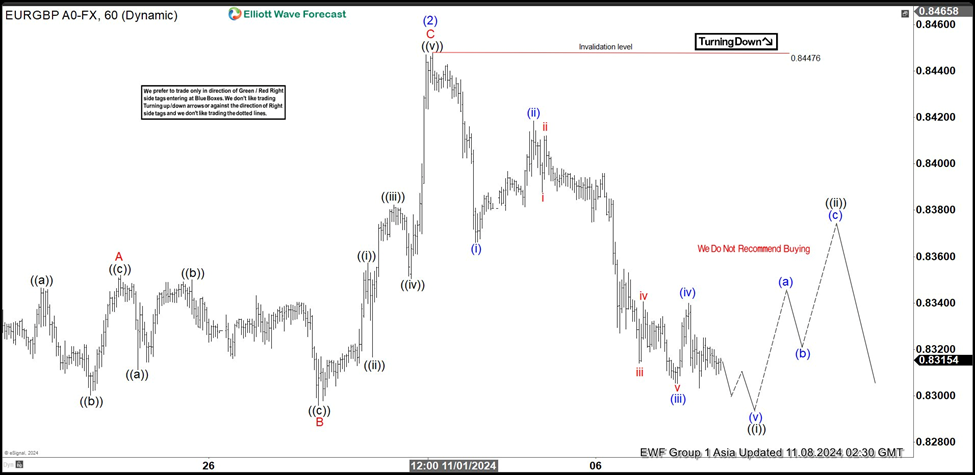
Short Term Elliott Wave View in EURGBP suggests that decline to 0.8295 on October 18, 2024 ended wave (1). Wave (2) corrective bounce is proposed complete at 0.8447 as the 1 hour chart below shows. Internal subdivision of wave (2) unfolded as a Flat Elliott Wave structure. Up from 10.18.2024 low, wave A ended at 0.8352 and wave B pullback ended at 0.8295. Wave C higher ended at 0.8447 which completed wave (2) in higher degree. Pair has turned lower in wave (3) with internal structure of an impulse.

Down from wave (2), wave (i) ended at 0.8366 and wave (ii) ended at 0.8418. Wave (iii) has resumed lower as an impulse. Down from wave (ii), wave i ended at 0.8388 and wave ii ended at 0.8412. Wave iii lower ended at 0.8414 and wave iv rally ended at 0.834. Last leg wave v lower ended at 0.8305 which completed wave (iii) in higher degree. Wave (iv) corrective rally ended at 0.833. Expect pair to extend lower to end wave v of ((i)). Then it should rally in wave ((ii)) to correct cycle from 11.1.2024 high before it resumes lower. Near term, as far as pivot at 0.8447 high stays intact, expect rally to fail in 3, 7, or 11 swing for further downside.

EUR/GBP 60 minutes Elliott Wave chart

EURGBP

EUR/GBP Elliott Wave [Video]

Author

Elliott Wave Forecast Team

Elliott Wave Forecast Team

ElliottWave-Forecast.com

More from Elliott Wave Forecast Team
Share:

Editor's Picks

EUR/USD tests nine-day EMA support near 1.1850

EUR/USD remains in the negative territory for the fourth successive session, trading around 1.1870 during the Asian hours on Friday. The 14-day Relative Strength Index momentum indicator at 56 stays above the midline, confirming steady momentum. RSI has eased but remains above 50, indicating momentum remains constructive for the bulls.

GBP/USD consolidates around 1.3600 vs. USD; looks to US CPI for fresh impetus

The GBP/USD pair remains on the defensive through the Asian session on Friday, though it lacks bearish conviction and holds above the 1.3600 mark as traders await the release of the US consumer inflation figures before placing directional bets.

Gold recovers swiftly from weekly low, climbs back closer to $5,000 ahead of US CPI

Gold regains positive traction during the Asian session on Friday and recovers a part of the previous day's heavy losses to the $4,878-4,877 region, or the weekly low. The commodity has now moved back closer to the $5,000 psychological mark as traders keenly await the release of the US consumer inflation figures for more cues about the Federal Reserve's policy path.

Solana: Mixed market sentiment caps recovery

Solana is trading at $79 as of Friday, following a correction of over 9% so far this week. On-chain and derivatives data indicates mixed sentiment among traders, further limiting the chances of a price recovery.

A tale of two labour markets: Headline strength masks underlying weakness

Undoubtedly, yesterday’s delayed US January jobs report delivered a strong headline – one that surpassed most estimates. However, optimism quickly faded amid sobering benchmark revisions.

Solana Price Forecast: Mixed market sentiment caps recovery

Solana (SOL) is trading at $79 as of Friday, following a correction of over 9% so far this week. On-chain and derivatives data indicates mixed sentiment among traders, further limiting the chances of a price recovery.