Elliott Wave View: EUR/USD Remains Bearish in Shorter Cycle [Video]
![Elliott Wave View: EUR/USD Remains Bearish in Shorter Cycle [Video]](https://editorial.fxstreet.com/images/Markets/Currencies/Majors/EURUSD/world-currencies-53475296_XtraLarge.jpg)
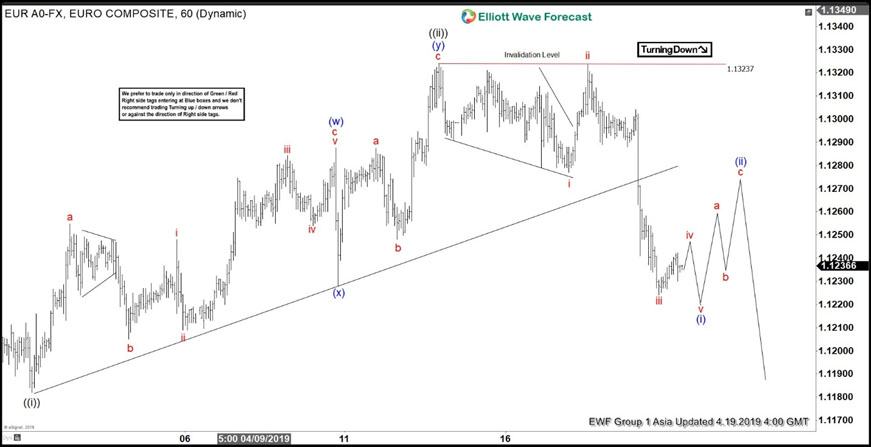
Since topping on February 16, 2018 high (1.255), EURUSD has continued to make a sequence of lower low. In the 1 hour chart below, the decline to 1.1183 ended wave ((i)) and the bounce to 1.132 ended wave ((ii)). The internal of wave ((ii)) subdivided as a double three Elliott Wave structure. Wave (w) of ((ii)) ended at 1.1287 as a zigzag and wave (x) of ((ii)) ended at 1.1228. Pair then rallied in wave (y) of ((ii)) to 1.132 as a zigzag. This is an example of a double zigzag, which is a special type of a double three. A double zigzag happens when both w and y in double three structure take the form of a zigzag.
Wave ((iii)) is in progress to the downside and subdivides as an impulse Elliott Wave structure. Down from 1.1324, wave i ended at 1.1277, wave ii ended at 1.132, and wave iii ended at 1.122. Expect another leg lower to end wave v of (i), then it should bounce in wave (ii) in 3, 7, or 11 swing to correct cycle from April 12 high (1.1323) before the decline resumes. We don’t like buying the pair and expect sellers to appear in 3, 7, or 11 swing as far as pivot at 1.132 stays intact.
1 Hour EURUSD Elliott Wave Chart Asia Update
1 Hour EURUSD Elliott Wave Video
Become a Successful Trader and Master Elliott Wave like a Pro. Start your Free 14 Day Trial at - Elliott Wave Forecast.
Author

Elliott Wave Forecast Team
ElliottWave-Forecast.com


