|

Elliott Wave view: EUR/JPY rallying from support area [Video]

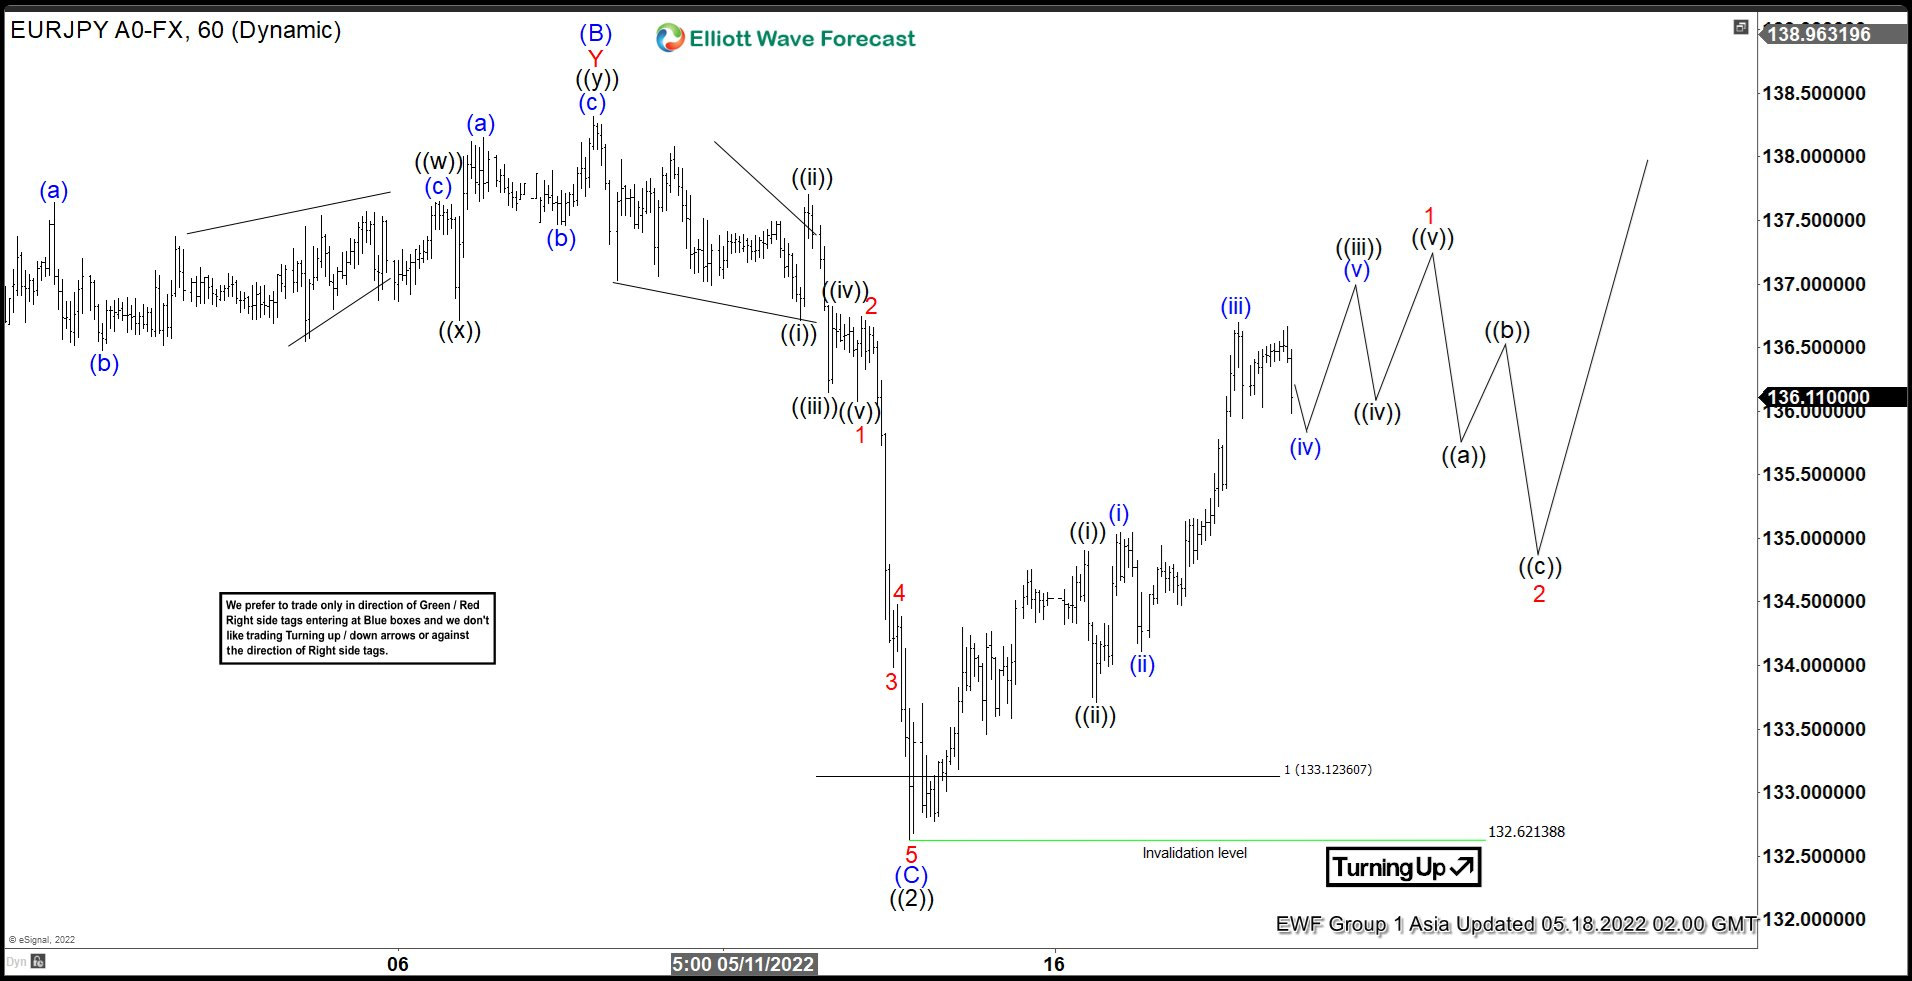
Short Term View in EURJPY suggests cycle from 04.21.2022 peak is completed as a 3 waves zig zag Elliott Wave Structure. Down from April 21 peak, wave (A) ended at 134.75 and rally in wave (B) ended at 138.32. Pair then resumes lower in wave (C) with internal subdivision as an impulse in lesser degree. Down from wave (B), wave 1 ended at 136.08 and pullback in wave 2 ended at 136.74. Pair then resumes lower in wave 3 towards 133.98, wave 4 ended at 134.48. Final wave 5 ended at 132.62 which completed wave (C) and wave ((2)).

Blue box started at 133.12. It was hit for the market and began a new cycle. This new cycle is unfolded as a motive wave structure. Up from wave ((2)), wave ((i)) ended at 134.90, wave ((ii)) ended at 133.70. Then wave (i) in lesser degree ended at 135.05, wave (ii) ended at 134.11 and continue with the rally. Wave (iii) ended at 136.69 and currently we are building wave (iv). After complete wave (iv), pair should resume higher in wave (v) and wave ((iii)). Then we should see a new pullback as wave ((iv)) and higher again to complete wave ((v)) and wave 1 to finish the impulse. Near term, as far as pivot at 132.62 low stays intact, expect pullback to find support in 3, 7, or 11 swing for further upside.

EUR/JPY 60 minutes Elliott Wave chart

EURJPY

EUR/JPY Elliott Wave video 

Author

Elliott Wave Forecast Team

Elliott Wave Forecast Team

ElliottWave-Forecast.com

More from Elliott Wave Forecast Team
Share:

Editor's Picks

EUR/USD holds lower ground near 1.1850 ahead of EU/ US data

EUR/USD remains in the negative territory for the fourth successive session, trading around 1.1850 in European trading on Friday. A broadly cautious market environment paired with modest US Dollar demand undermines the pair ahead of the Eurozone GDP second estimate and the critical US CPI data. 

GBP/USD keeps losses around 1.3600, awaits US CPI for fresh impetus

GBP/USD holds moderate losses at around 1.3600 in the European session on Friday, though it lacks bearish conviction. The US Dollar remains supported amid softer risk tone and ahead of the US consumer inflation figures due later in the NA session on Friday. 

Gold trims intraday gains to $5,000 as US inflation data loom

Gold retreats from the vicinity of the $5,000 psychological mark, though sticks to its modest intraday gains heading into the European session. Traders now look forward to the release of the US consumer inflation figures for more cues about the Fed policy path. The outlook will play a key role in influencing the near-term US Dollar price dynamics and provide some meaningful impetus to the non-yielding bullion.

Solana: Mixed market sentiment caps recovery

Solana is trading at $79 as of Friday, following a correction of over 9% so far this week. On-chain and derivatives data indicates mixed sentiment among traders, further limiting the chances of a price recovery.

A tale of two labour markets: Headline strength masks underlying weakness

Undoubtedly, yesterday’s delayed US January jobs report delivered a strong headline – one that surpassed most estimates. However, optimism quickly faded amid sobering benchmark revisions.

Solana Price Forecast: Mixed market sentiment caps recovery

Solana (SOL) is trading at $79 as of Friday, following a correction of over 9% so far this week. On-chain and derivatives data indicates mixed sentiment among traders, further limiting the chances of a price recovery.