|

Elliott Wave structure: Gold targeting final leg of wave five [Video]

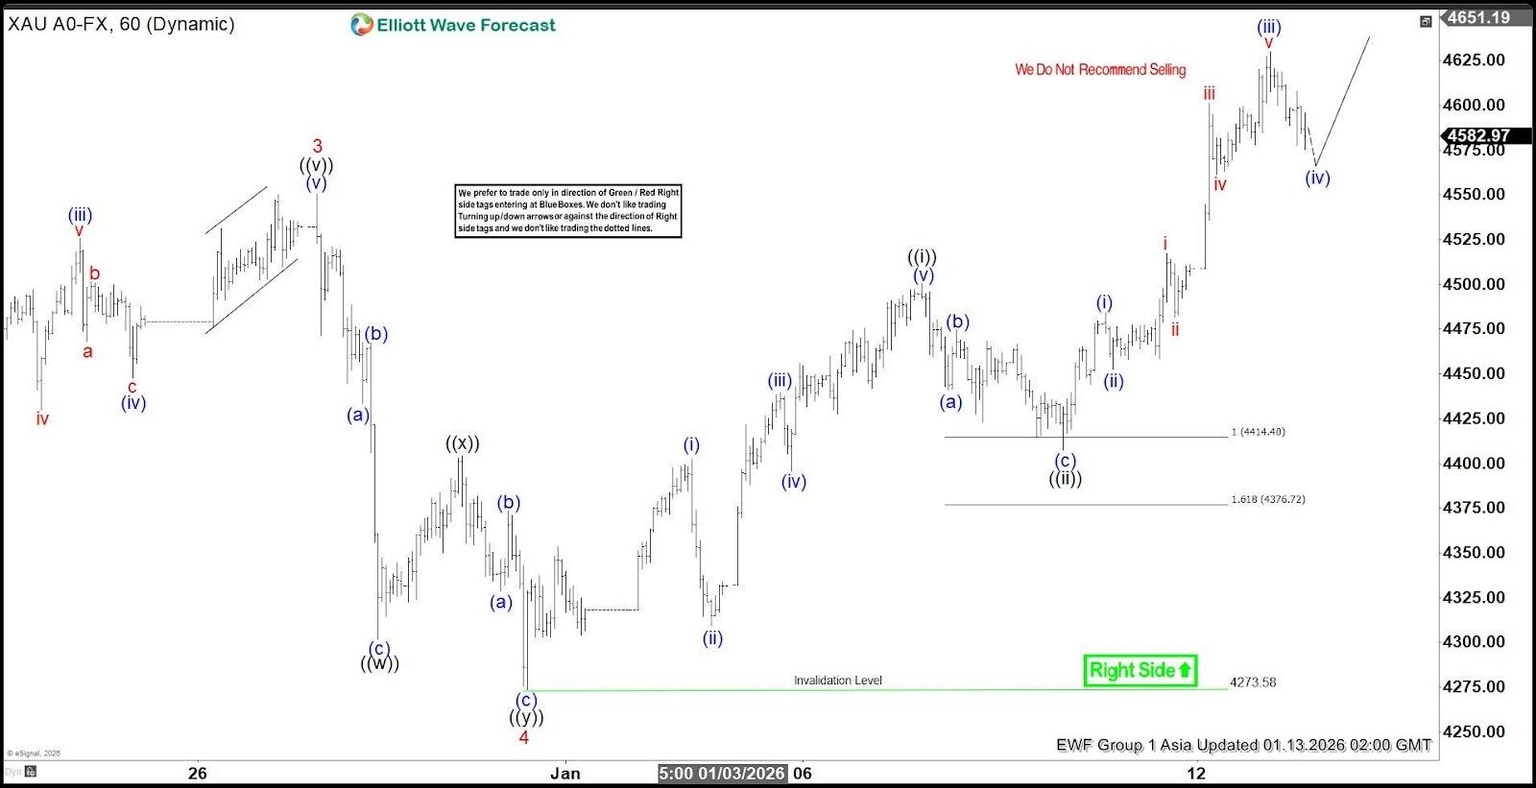
Gold (XAUUSD) continues to advance to fresh all‑time highs, reinforcing a firmly bullish trend across the broader market. The metal is now progressing toward the completion of wave 5 within the Elliott Wave framework. The rally to $4550.52 marked the termination of wave 3, after which a corrective phase unfolded. Wave 4 developed as a double three structure, reflecting a complex but orderly consolidation. From the peak of wave 3, wave ((w)) concluded at $4301.79, followed by wave ((x)) at $4404.41. The final leg, wave ((y)), ended at $4273.58, thereby completing wave 4 at a higher degree.

Following this correction, gold resumed its upward trajectory in wave 5. The current advance is unfolding as an impulsive sequence in lesser degree. From the base of wave 4, wave (i) finished at $4402.35, while the subsequent dip in wave (ii) reached $4309.42. Momentum carried wave (iii) to $4439.90, before a modest pullback in wave (iv) ended at $4395.92. The final push in wave (v) reached $4500.64, completing wave ((i)) of higher degree. A corrective zigzag in wave ((ii)) then ended at $4407.44.

The metal has since resumed higher in wave ((iii)). From that point, wave (i) concluded at $4483.99, while wave (ii) retraced to $4452.58. Strong buying pressure lifted wave (iii) to $4630.24, confirming renewed bullish momentum. In the near term, as long as the pivot at $4273.58 remains intact, dips are expected to find support. These supports typically emerge in three, seven, or eleven swing sequences, offering traders opportunities to align with the prevailing upside trend.

Gold 60 minute chart from 01.13.2026 update

Gold Elliott Wave [Video]

Youtube preview

Author

Elliott Wave Forecast Team

Elliott Wave Forecast Team

ElliottWave-Forecast.com

More from Elliott Wave Forecast Team
Share:

Editor's Picks

EUR/USD falls toward 1.1650 after retreating from moving averages

EUR/USD edges lower after registering modest gains in the previous session, trading around 1.1660 during the Asian hours on Monday. The 14-day Relative Strength Index momentum indicator at 42.69 sits below the 50 midline and is easing, confirming a bearish tilt. RSI near 43 keeps sellers in control without reaching oversold, suggesting consolidation could precede follow-through.

GBP/USD holds steady around 1.3475 as traders seem hesitant ahead of US CPI report

The GBP/USD pair edges higher for the second straight day on Tuesday and looks to build on the previous day's recovery from the 1.3390 region, or a three-week low. Spot prices currently trade around the 1.3475 region, up nearly 0.10% for the day.

Gold consolidates below $4,600, remains close to record high as US CPI report looms

Gold is seen consolidating below the all-time peak, touched the previous day, and the $4,600 mark during the Asian session on Tuesday as traders opt to wait for the release of the latest US consumer inflation figures. The crucial data might offer more cues about the US Federal Reserve's rate-cut path, which, in turn, will influence the near-term US Dollar price dynamics and provide a fresh directional impetus to the non-yielding yellow metal. 

DOGE, SHIB, and PEPE bulls struggle to regain strength

Meme coins, including Dogecoin, Shiba Inu, and Pepe, remain under extreme selling pressure, recording roughly seven days of downtrend following the January 4 spike.

The week ahead: Earnings season meets Donald Trump in a big week for markets

Federal investigation of Powell and the Fed knocks risk sentiment. Concerns grow about Fed independence as gold hits a record. Are markets expecting Trump to scale back his rhetoric?

Meme Coins Price Prediction: DOGE, SHIB, and PEPE bulls struggle to regain strength

Meme coins, including Dogecoin, Shiba Inu, and Pepe remain under extreme selling pressure, recording roughly seven days of downtrend following the January 4 spike. The meme coins risk a bearish shift in momentum as buying pressure subsides, potentially leading to further declines.