|

Elliott Wave count suggests further upside in USD/CAD [Video]

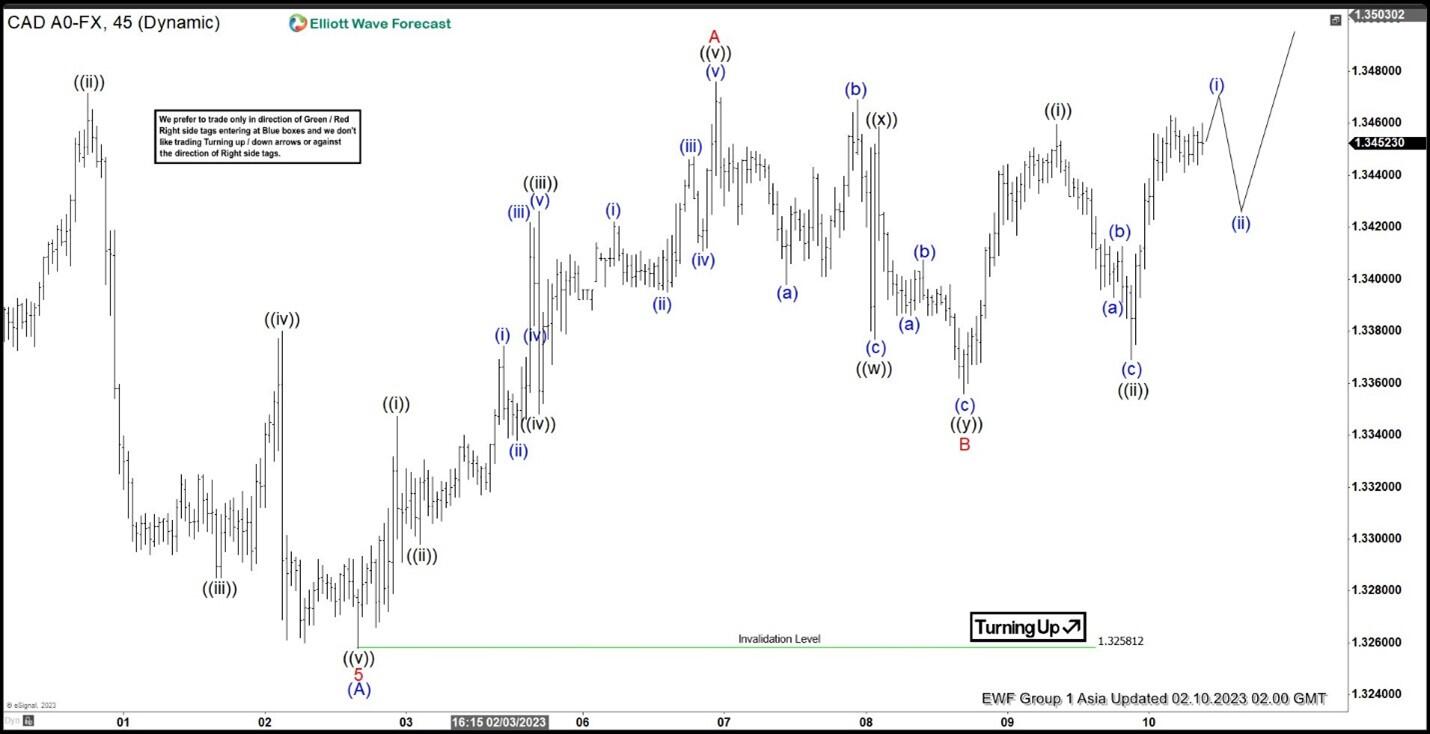
Short term Elliott Wave in USD/CAD suggests the decline from 12.17.2022 high ended at 1.3258 as wave (A). Down from 12.17.2022 peak, wave 1 ended at 1.348 and rally in wave 2 ended at 1.3685. Pair extends lower again in wave 3 towards 1.3318 and bounce in wave 4 ended at 1.352. Final leg lower wave 5 ended at 1.3258 which completed wave (A). Wave (B) rally is currently in progress with internal subdivision as a zigzag Elliott Wave structure.

Up from 2.2.2023 low, wave ((i)) ended at 1.3347 and dips in wave ((ii)) ended at 1.3298. Pair extends higher in wave ((iii)) towards 1.3426, and pullback in wave ((iv)) ended at 1.3352. Final leg wave ((v)) ended at 1.3475 which completed wave A in higher degree. Pullback in wave B unfolded as a double three Elliott Wave structure and ended at 1.3356. Down from wave A, wave ((w)) ended at 1.337 and wave ((x)) ended at 1.3458. The third leg wave ((y)) ended at 1.3356 which completed wave B. Pair has turned higher in wave C but still needs to break above wave A at 1.3475 to rule out a double correction. Up from wave B, wave ((i)) ended at 1.3459 and dips in wave ((ii)) ended at 1.3369. Near term, as far as pivot at 1.3258 stays intact, expect pair to extend higher.

USD/CAD 45 minutes Elliott Wave chart

USD/CAD Elliott Wave video

Author

Elliott Wave Forecast Team

Elliott Wave Forecast Team

ElliottWave-Forecast.com

More from Elliott Wave Forecast Team
Share:

Editor's Picks

EUR/USD holds firm above 1.1900 as US NFP looms

EUR/USD holds its upbeat momentum above 1.1900 in the European trading hours on Wednesday, helped by a broadly weaker US Dollar. Markets could turn cautious later in the day as the delayed US employment report for January will takes center stage. 

GBP/USD remains above nine-day EMA near 1.3650

GBP/USD recovers its recent losses from the previous session, trading around 1.3680 during the European hours on Wednesday. The technical analysis of the daily chart indicates a sustained bullish bias, as the pair trades within an ascending channel pattern.

Gold sticks to gains near $5,050 as focus shifts to US NFP

Gold holds moderate gains near the $5,050 level in the European session on Wednesday, reversing a part of the previous day's modest losses amid dovish US Federal Reserve-inspired US Dollar weakness. This, in turn, is seen as a key factor acting as a tailwind for the non-yielding yellow metal ahead of the critical US NFP release. 

US Nonfarm Payrolls expected to show modest job gains in January

The United States Bureau of Labor Statistics will release the delayed Nonfarm Payrolls data for January on Wednesday at 13:30 GMT. Investors expect NFP to rise by 70K following the 50K increase recorded in December.

S&P 500 at 7,000 is a valuation test, not a liquidity problem

The rebound from last week’s drawdown never quite shook the sense that it was being supported by borrowed conviction. The S&P 500 once again tested near the 7,000 level (6,986 as the high watermark) and failed, despite a macro backdrop that would normally be interpreted as supportive of risk.

Bitcoin price slips below $67,000 ahead of US Nonfarm Payrolls data

Bitcoin price extends losses, and trades below the lower consolidating boundary at $67,300 at the time of writing. A firm close below this level could trigger a deeper correction for BTC. Despite the weakness in price action, institutional demand shows signs of support, recording mild inflows in ETFs so far this week.