Elliott Wave Analysis: USD Index Trading In A Simple Zig-zag; More Weakness In View

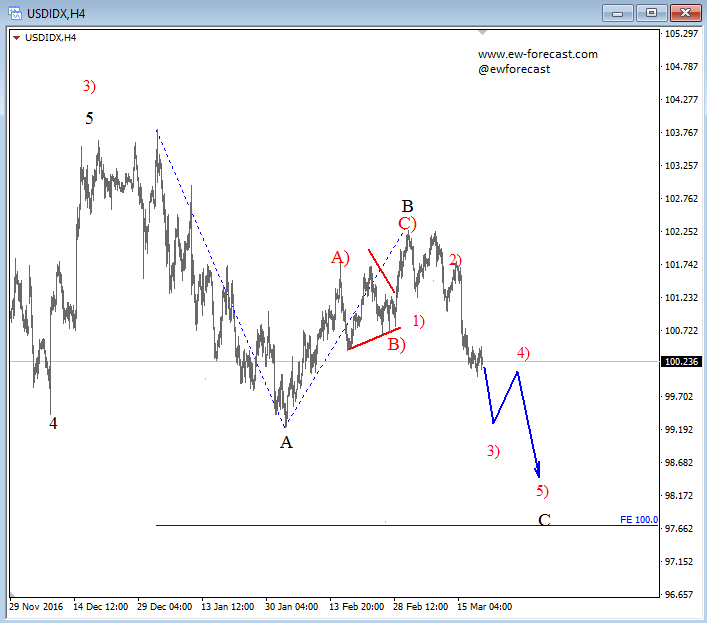
On the 4h chart of USD Index we see price trading within a higher degree three wave decline and current bearish breakdown may be part of wave C. At the moment we see price trading within the strongest and steepest sub-wave 3). If we are on the right track, then even more weakness may follow within the mentioned wave and ideally towards the 98.00 region.
USD Index, 4H
Take Your 1€ Trial Today And Get Similar Forecast Daily On 18 Markets at EW-Forecast.
Author

Gregor Horvat
Wavetraders
Experience Grega is based in Slovenia and has been in the Forex market since 2003.
More from Gregor Horvat


