Elliott Wave Analysis of XBI (Biotech ETF)
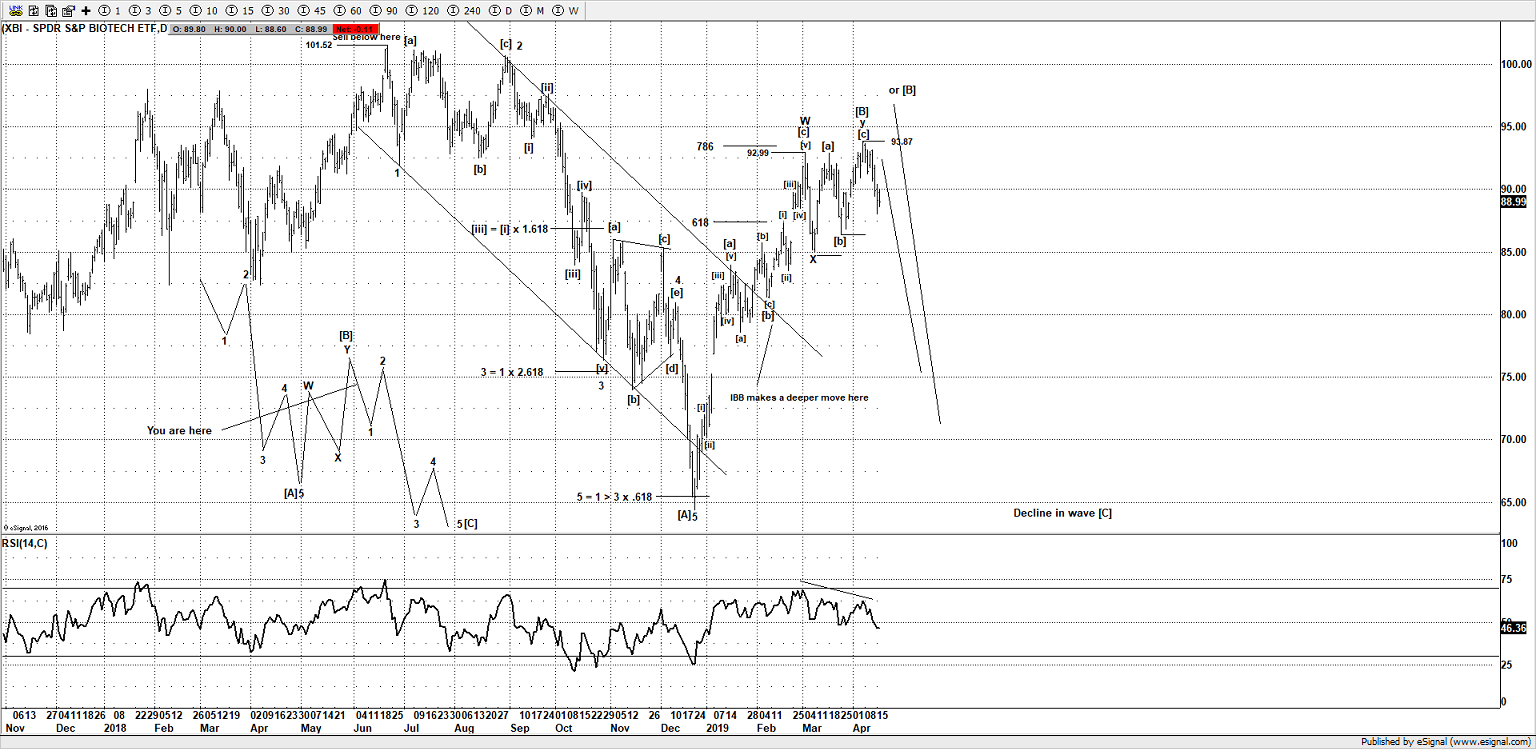
This is one area of the market that is actually showing some weakness compared to the NDX and SPX, so it could be a warning for both those markets. The reversal from the last minor swing high at $93.87 could be favoring a peak in place, although I would still allow for a bit more upside to end wave [B] if needed.
As long as it fails to make a new high above $101.52, then it has a bearish setup for a move lower and tests $60.00 - 55.00 to end wave [C] to complete a large 3 wave decline from $101.52.
Bearish below $101.52, but tentatively looking lower below $93.87.
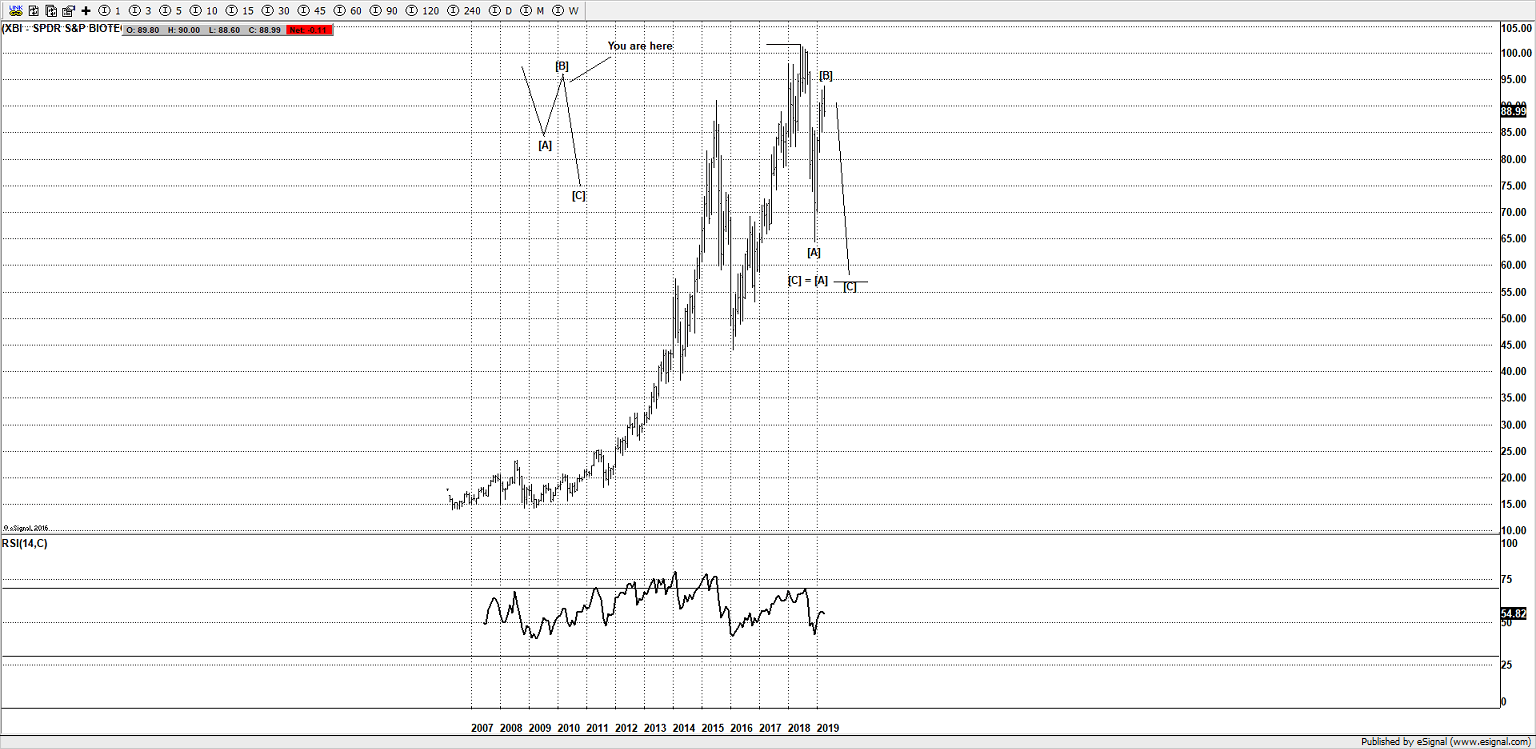

For those readers that have doubts about a decline below $60.00, I will leave you with a chart that I posted before the 2018 swoon. If you are bullish biotech stocks I would tread very carefully, a strong move below $85.00 on XBI could well be a strong sign of further weakness for biotech stocks.

Author

Wave Pattern Traders Team
Wave Pattern Traders
Specialists in the use of Elliott Wave, Market Analysis, Fractals & Fibonacci.


