Elliott wave Analysis :NGas, EURUSD, USDJPY and EURGBP

NGas
TECHNICAL ANALYSIS
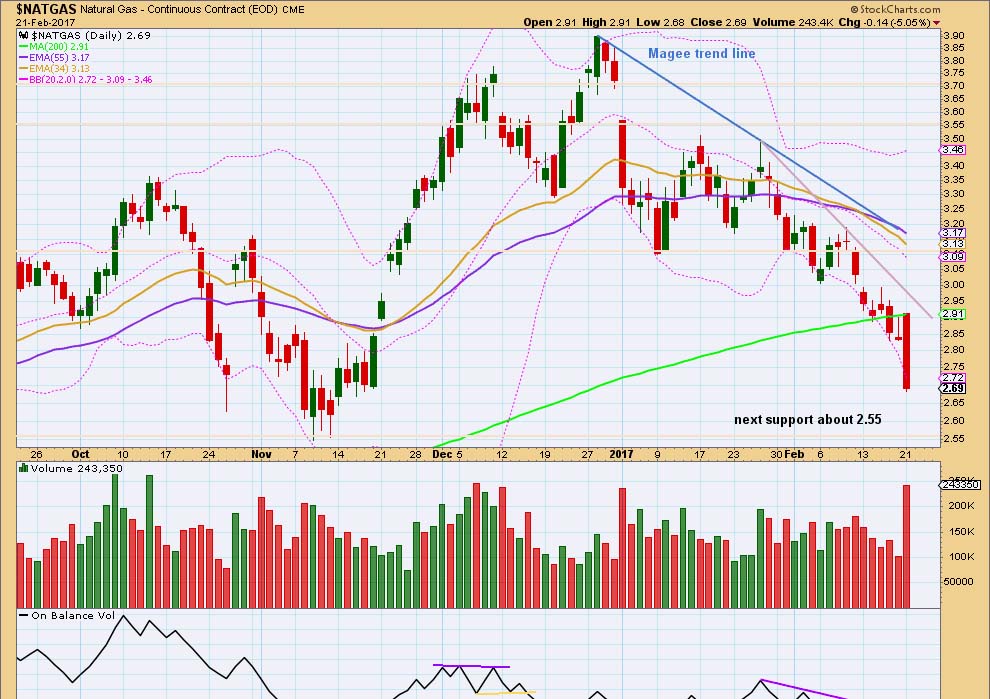
Natural Gas continues lower as the last analysis expected. Today's strong volume spike may be a selling climax. In the short term, it may be followed by a small consolidation before price may continue lower. For the very short term, if price breaks above the steeply sloping rose trend line, then look out for a deeper correction. Expect price to fall to next support at 2.55 while price remains below that line. This trend is not yet extreme and there is no divergence yet between price and RSI to indicate weakness.
ELLIOTT WAVE ANALYSIS MAIN WAVE COUNT – WEEKLY CHART
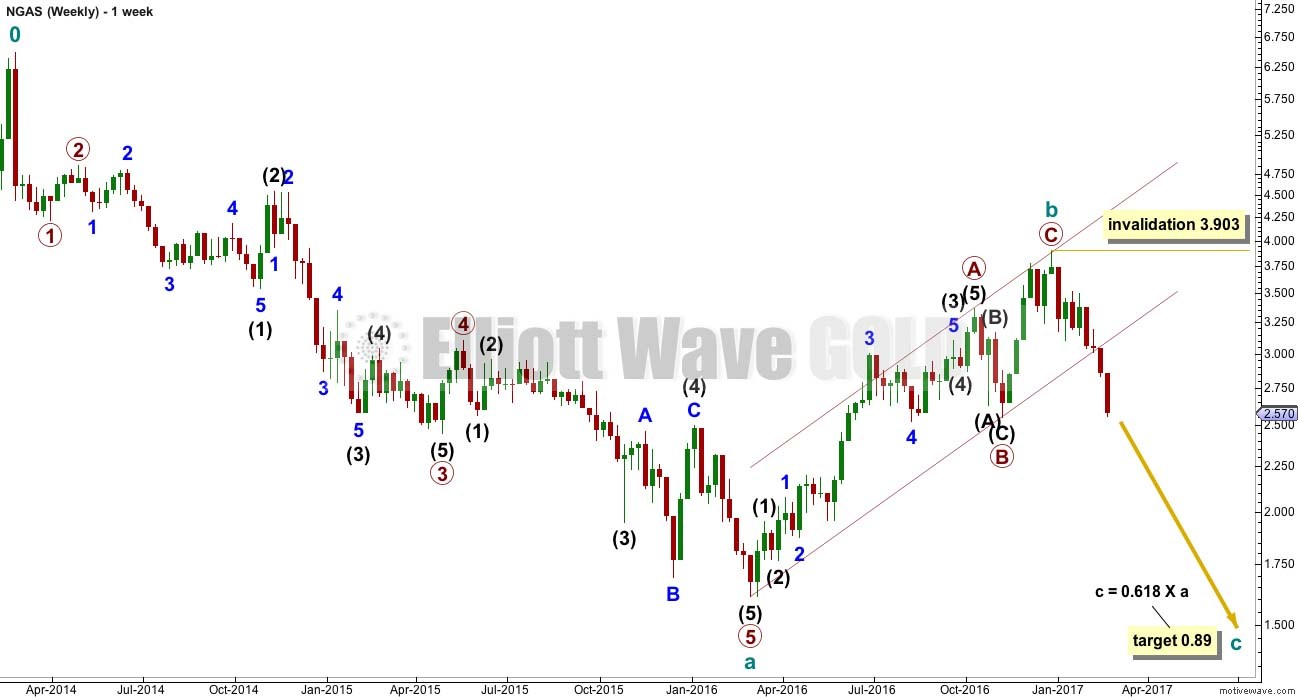
This wave count expects Natural Gas is in a new bear market to last one to several years.
MAIN WAVE COUNT – DAILY CHART
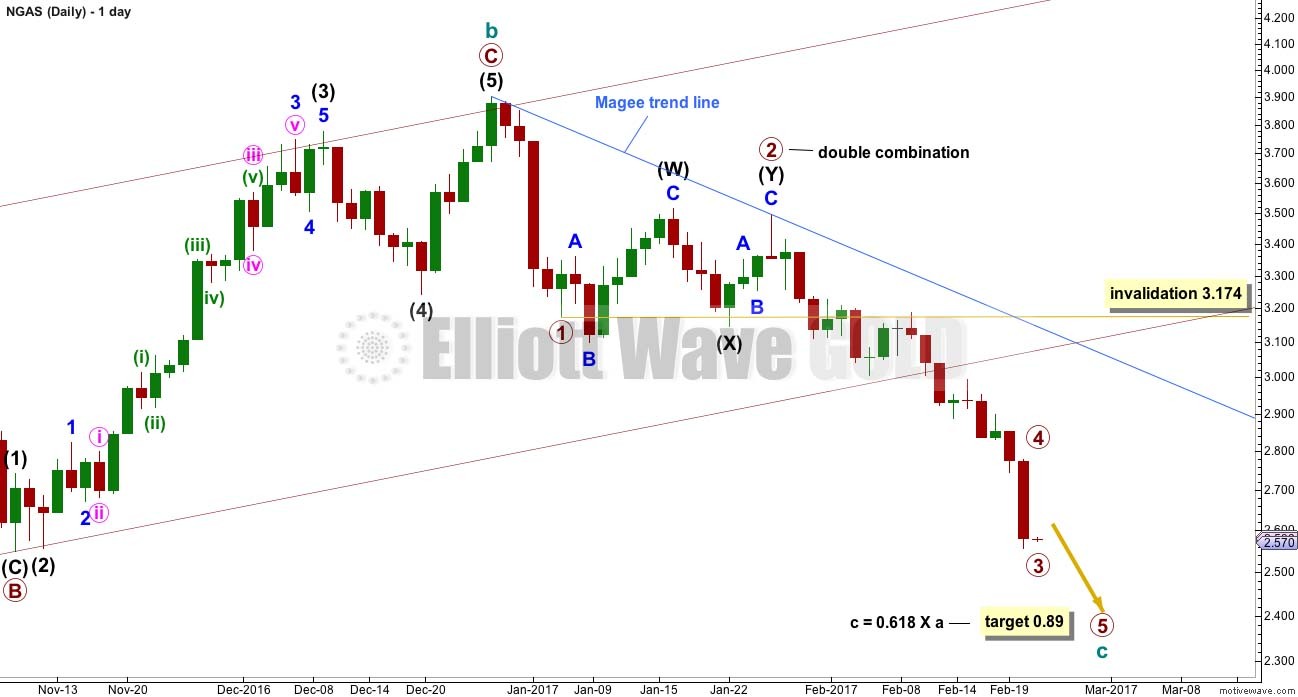
If a deeper correction does develop here after the selling climax, then it may be a primary degree fourth wave that may last a Fibonacci 13 or 21 days. First, the rose trend line on the TA chart above must be breached to indicate primary 3 is over. So far it is less than 1.618 the length of primary wave 1, so it is likely to continue 2 of 9 further.
ALTERNATE WAVE COUNT – WEEKLY CHART
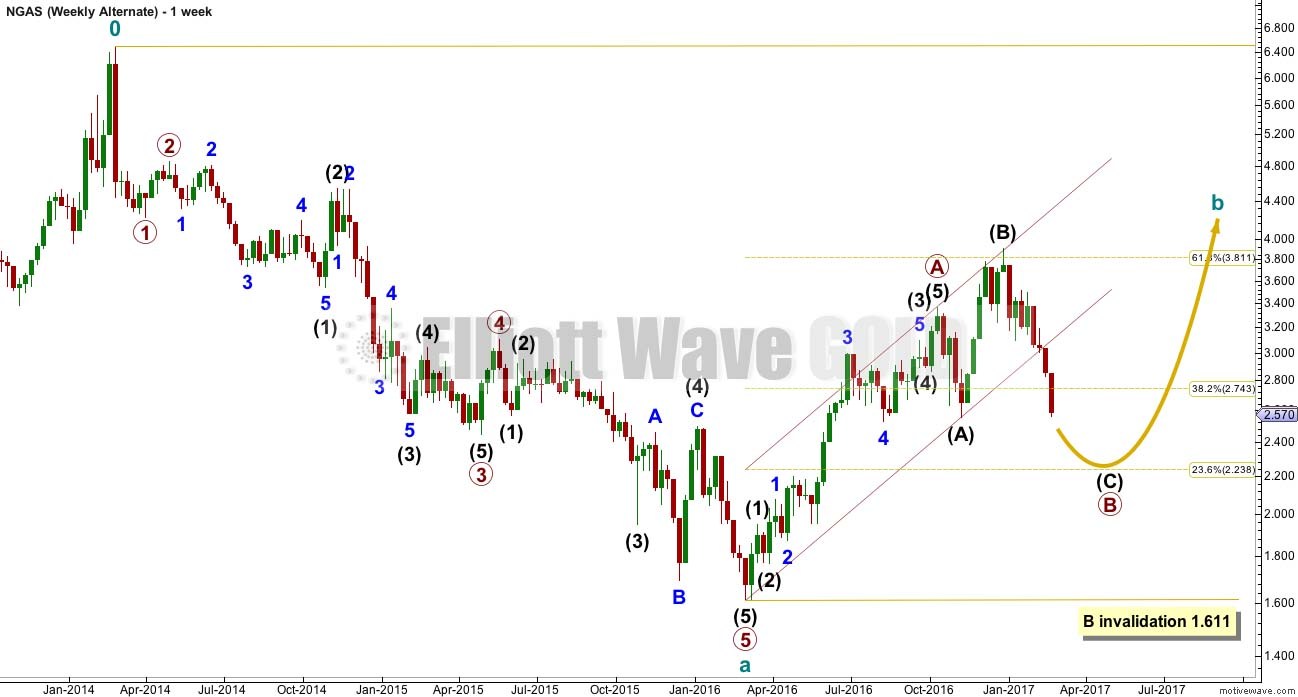
Downwards movement from the last high may be primary wave B coming to an end as a very common expanded flat correction.
ALTERNATE WAVE COUNT – DAILY CHART
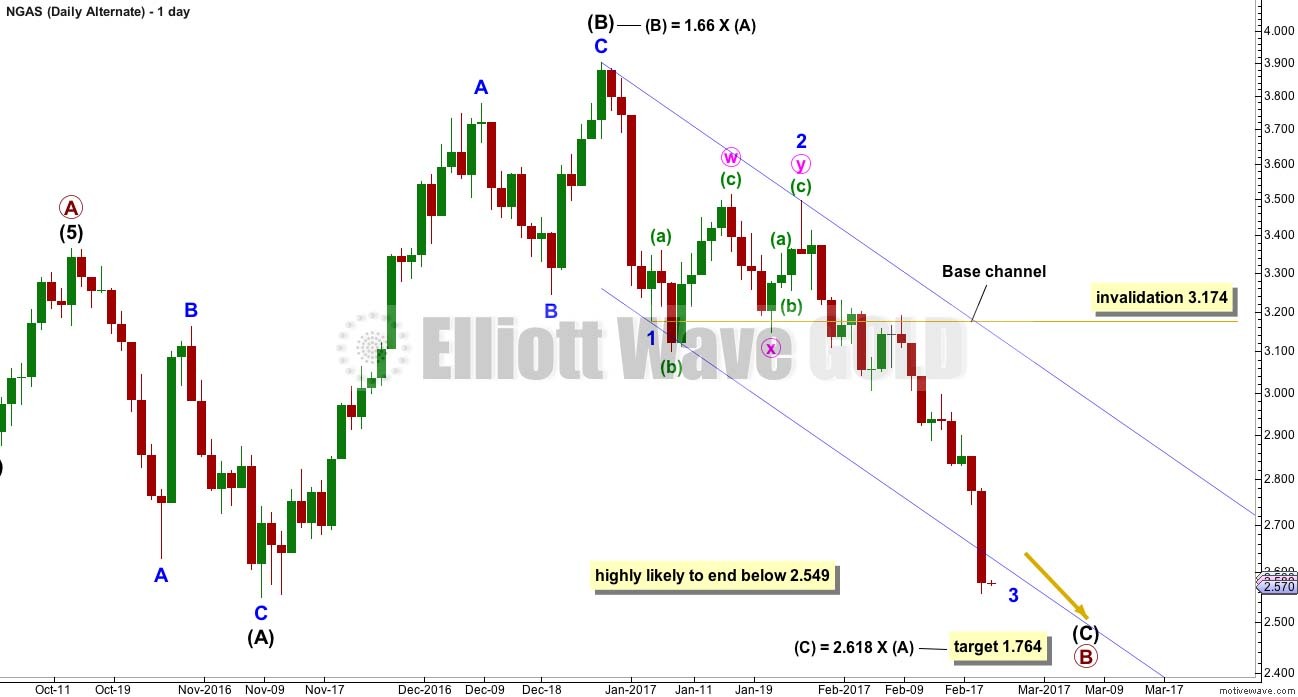
Minor wave 3 has only just broken below the lower edge of the base channel. This is how a third wave should behave. The selling climax of the 21st of February may be followed by a brief shallow correction before price continues lower to complete minor wave 3. Minor wave 4 may not move into minor wave 1 price territory.
Both Elliott wave counts expect Natural Gas to continue lower from here at least to make a new low below 2.549. That has not happened yet.
USDJPY
TECHNICAL ANALYSIS
I have published this pair often in Trading Room. That is because I consider it to be a good opportunity at this time. The idea of Trading Room is to look for markets that are trending and find entry points to join the trend in order to have a wider range of opportunities to profit from.
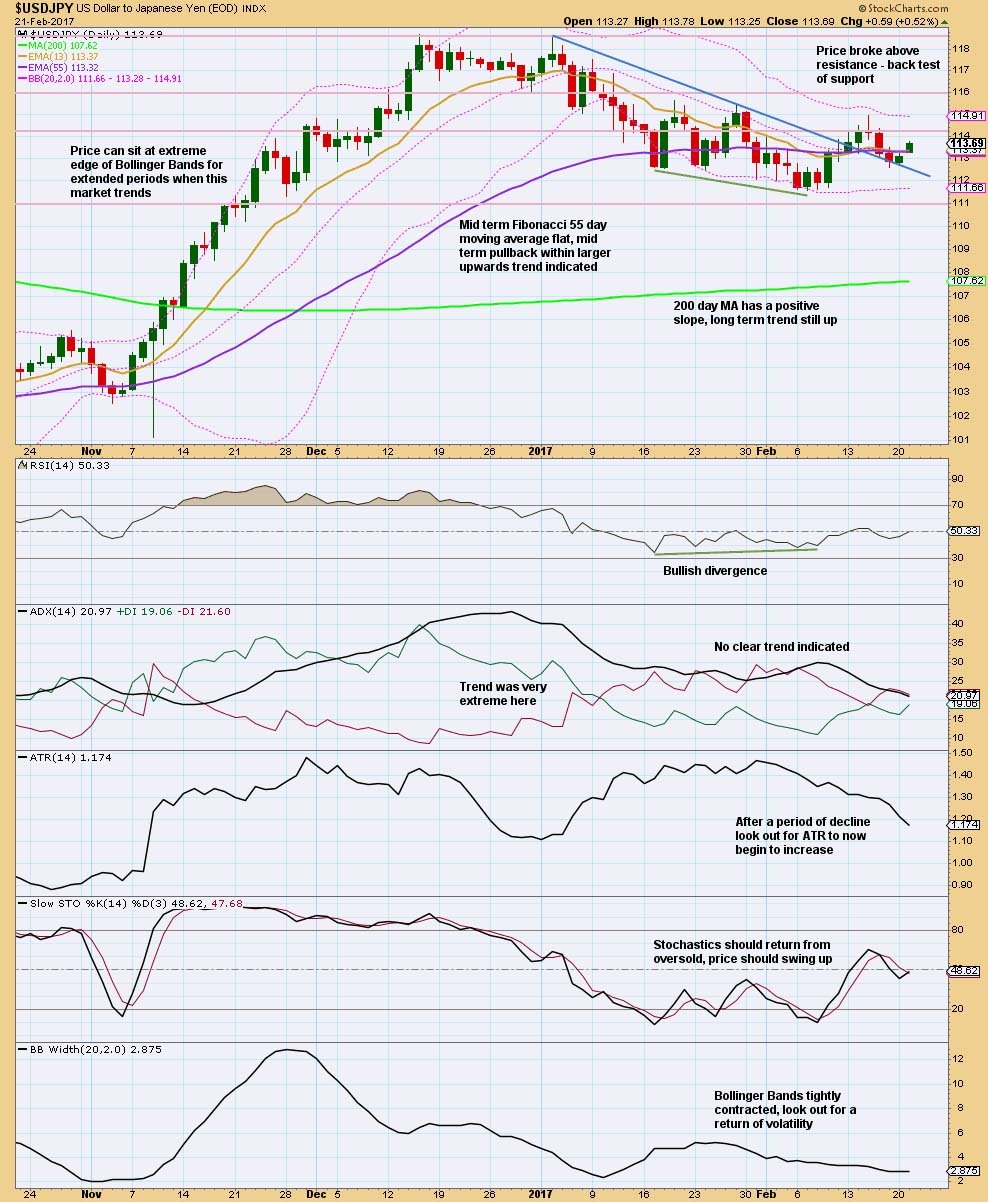
This is my favourite trade set up: a breach of a trend line followed by a back test of support or resistance. USDJPY has done this with the blue trend line.
The risk with this set up is that the trend line is too steep and not often tested, so price may break back below it. The risk does not at this stage look to be high, but it must be acknowledged.
Trading advice for members only: Stops may be set just below the low of the 17th of February at 112.58 or more conservatively a little below the blue trend line to allow for a second back test. Use the Elliott wave count for targets. If already long this pair, move stops up to breakeven to reduce risk and consider adding to the position.
ELLIOTT WAVE ANALYSIS
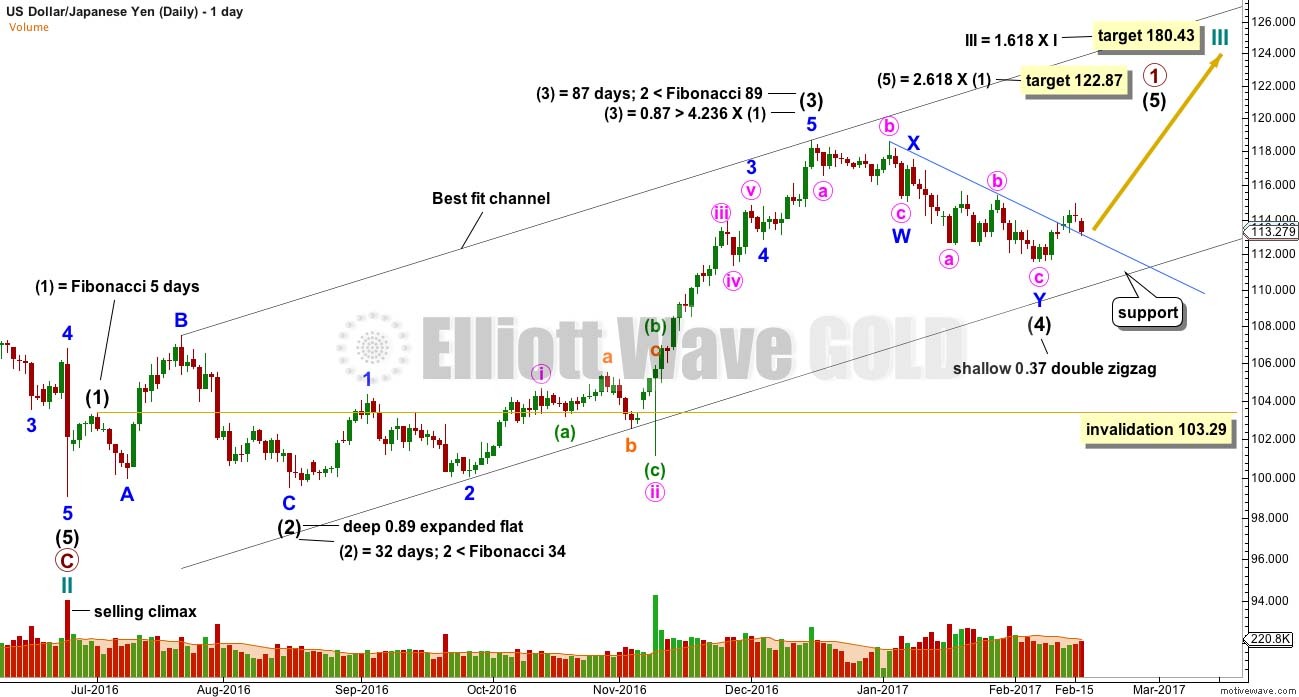
This market is behaving as expected so far.
EURUSD
TECHNICAL ANALYSIS
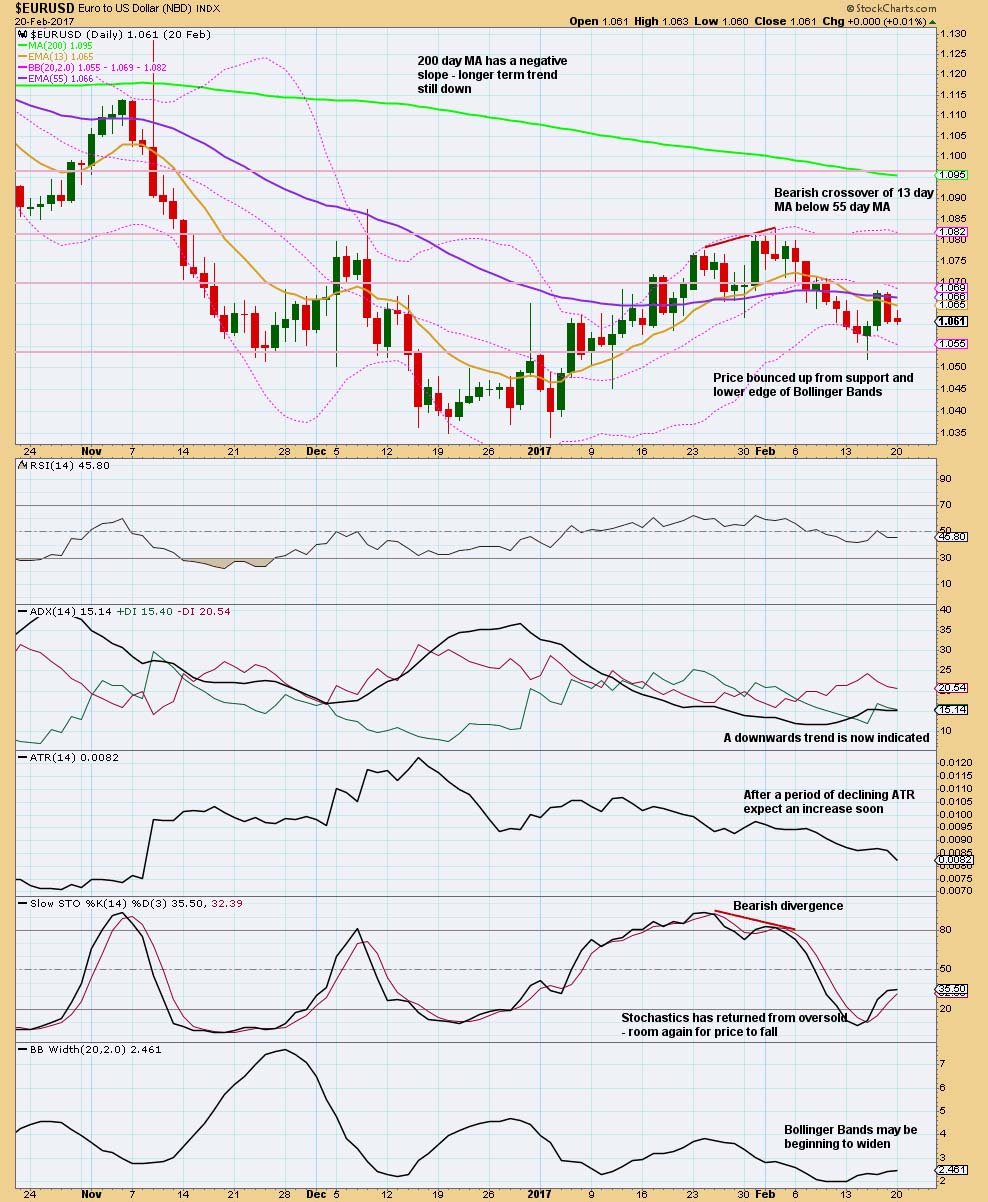
Last analysis of this pair expected a bounce to unfold after the candlestick of the 15th of February showed a bullish long lower wick. This was followed by a strong upwards day, and now a strong downwards day.
This is not correctly a bearish reversal pattern; the red candlestick for the 17th of February does not engulf the green candlestick for the 16th of February. However, it is still a strong downwards day and is bearish. Price may now be finding some resistance at the Fibonacci 13 day moving average and the mid line of Bollinger Bands.
ELLIOTT WAVE ANALYSIS
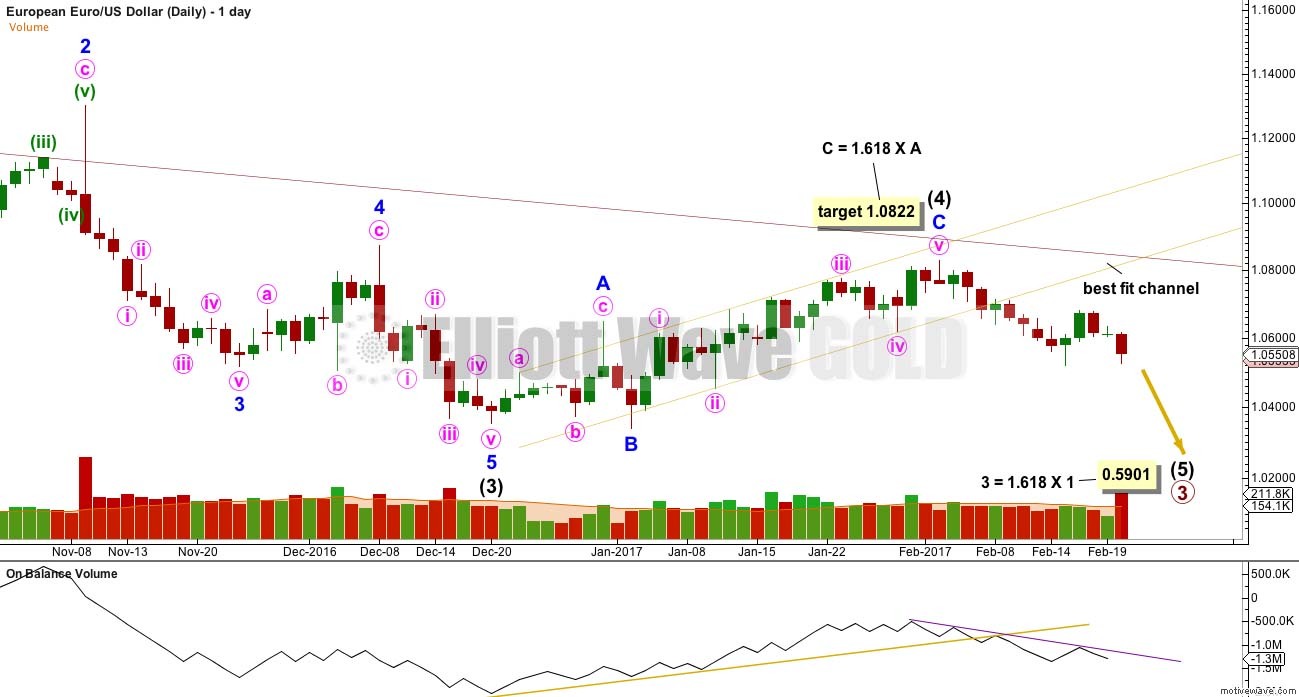
On Balance Volume remains bearish. A purple resistance line is added. The last test is another small bearish signal.
EURGBP
TECHNICAL ANALYSIS
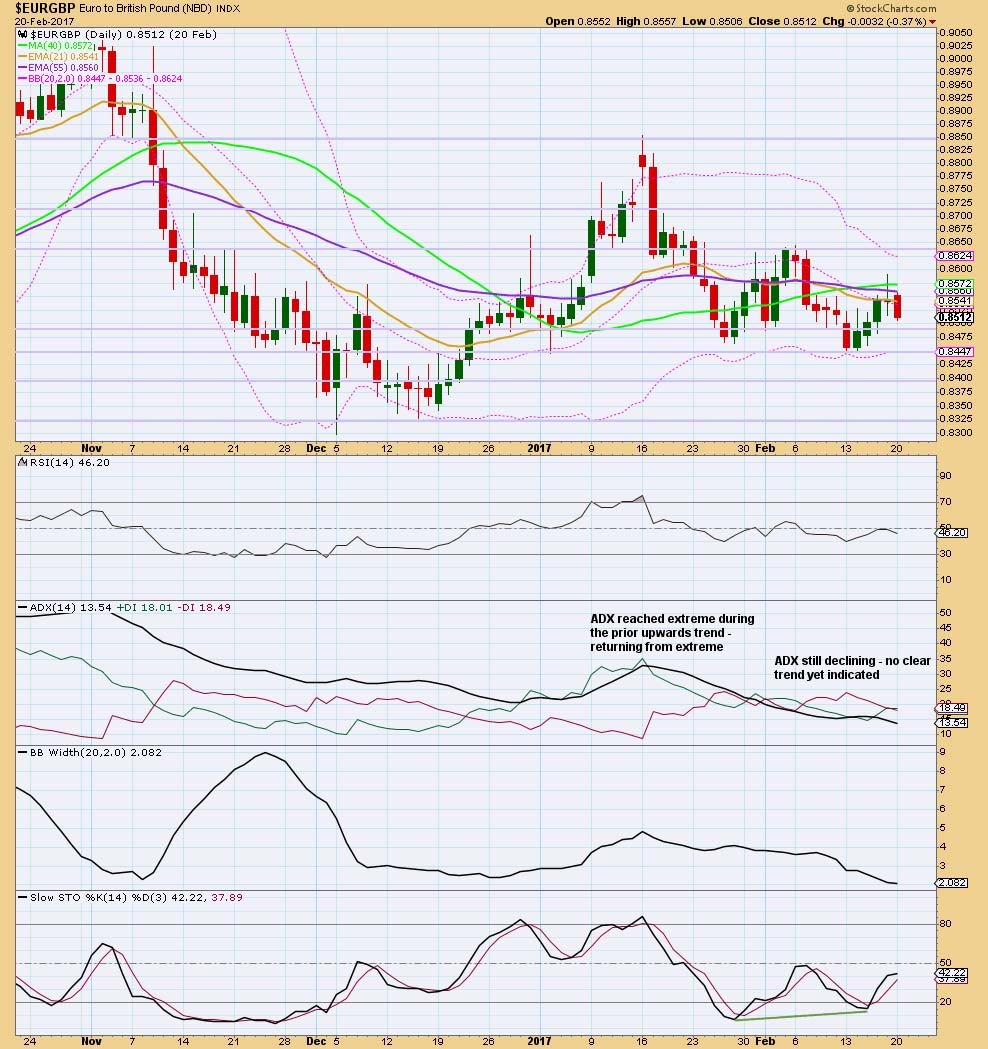
This pair is presented in response to a member's request. While the Elliott wave count is bearish, this classic analysis is not so much.
The last two upwards trends reached extreme. Since the high on the 16th of January downwards movement has brought ADX down from extreme. There is again room for a trend to develop.
This market currently looks range bound. Resistance is about 0.8650 and support is about 0.8450. The bottom line is a breakout would be required before any confidence may be had that this market is trending.
ELLIOTT WAVE ANALYSIS
MONTHLY CHART
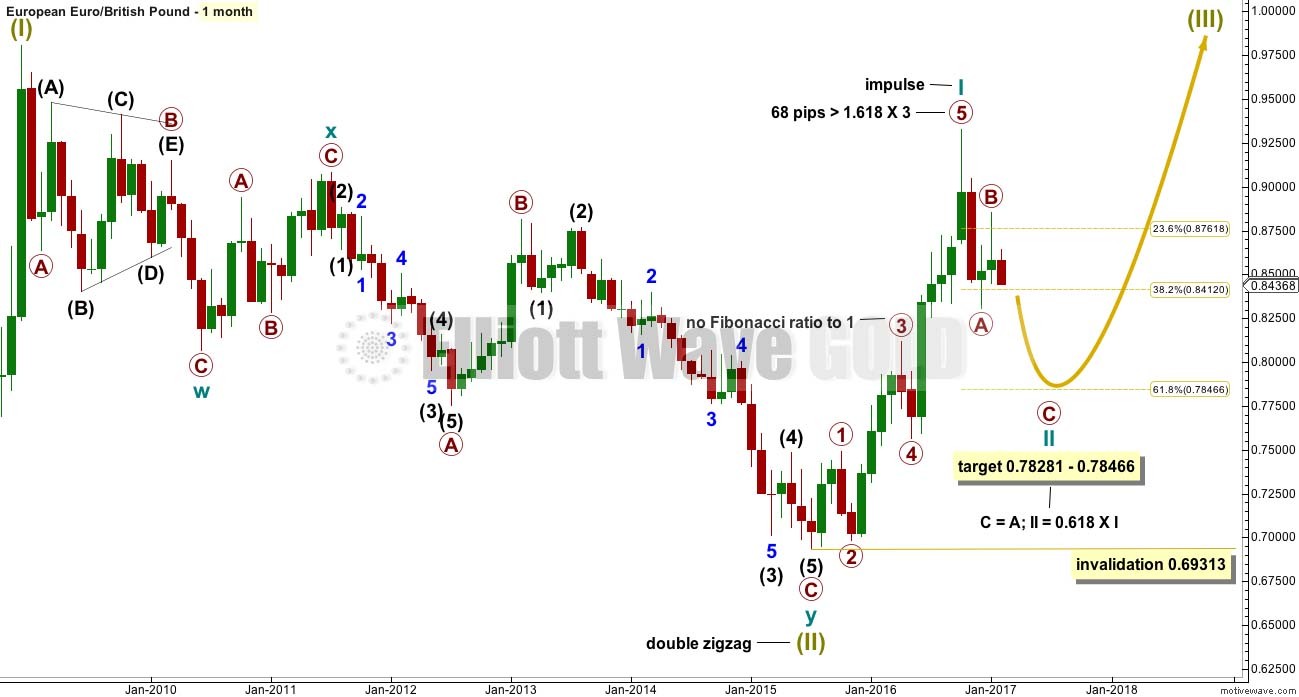
The large downwards wave labelled Super Cycle wave (II) will not fit as a five wave structure. It will only fit as a three. This may be the end of the bear market.
The upwards wave labelled cycle wave I looks like a very good five wave impulse. It should be expected to reasonably be followed by a three wave down movement for a second wave correction, which is most likely to end close to the 0.618 Fibonacci ratio.
DAILY CHART
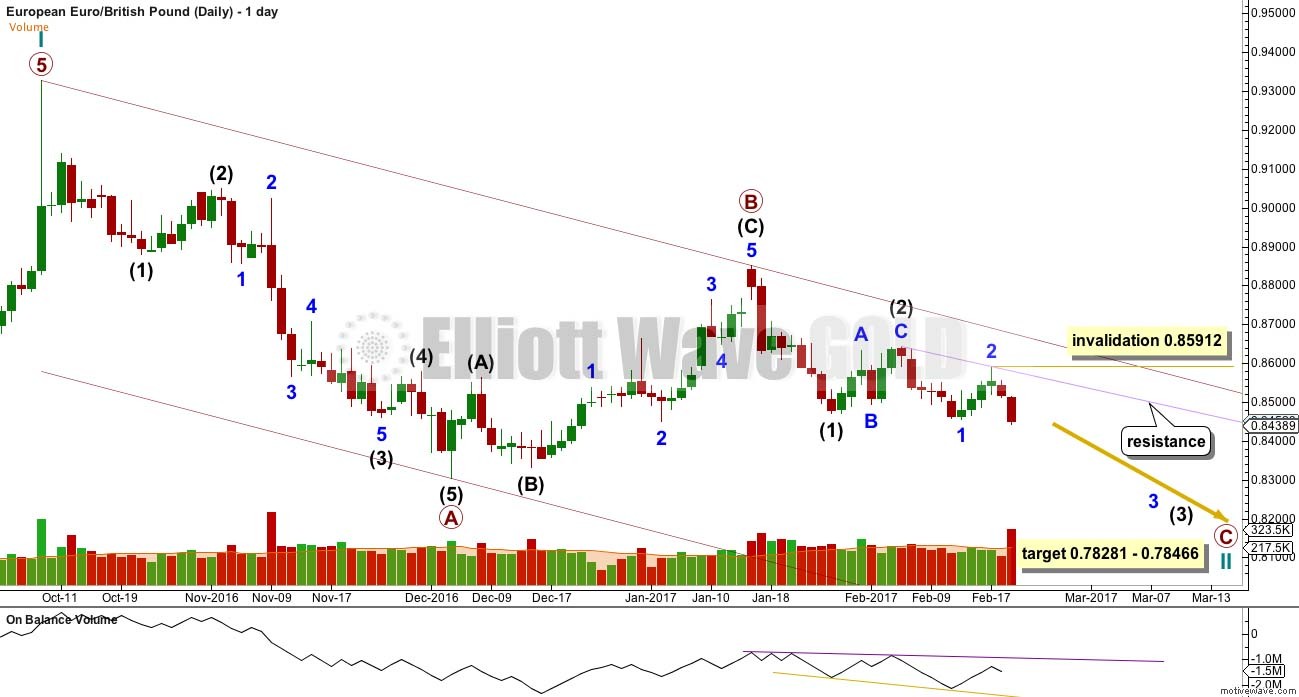
C has not yet moved beyond the end of A to avoid a truncation. The target has a good probability.
While classic analysis is not very bearish, this Elliott wave count is.
Use the lilac line for resistance.
Volume analysis: The strong volume for the last session of the 21st of February supports this wave count. The fall in price is supported by volume here as a third wave should be. On Balance Volume is giving no signal, either bullish or bearish.
Become a Successful Trader and Master Elliott Wave like a Pro. Start your Free 14 Day Trial at - Elliott Wave Forecast.
Author

Elliott Wave Forecast Team
ElliottWave-Forecast.com


