Elliott wave Analysis: Crude oil, BTCUSD and USDCAD
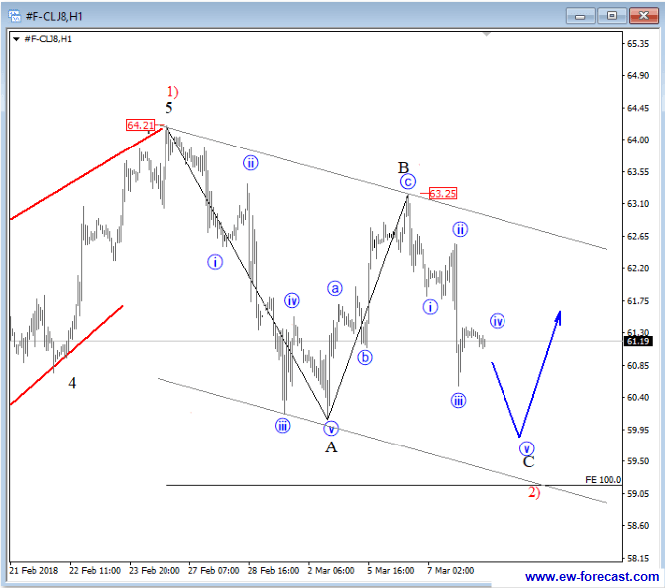
Crude oil came lower yesterday but still not into the bear market, as leg down from 63.25 can be wave C of a zigzag down from 64.21 as shown on the updated wave structure. Pay attention to 59.00 area where bounce can occur.
Crude oil, 1H
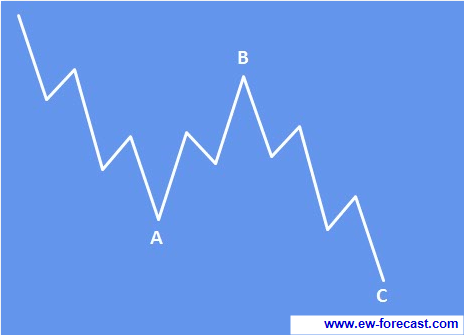
A zig-zag is a 3-wave structure labelled A-B-C, generally moving counter to the larger trend. It is one of the most common corrective Elliott patterns. Its structure is 3-3-3.
Zig-zag pattern:
Crypto market is lower for the last 48 hours and this weakness we can label as wave c. So far there was a nice reaction down, a clear impulse so watch out for a five wave drop before market may see support; ideally, that will be at 8k-9k area, where a new bounce can occur.
BTCUSD, 2H

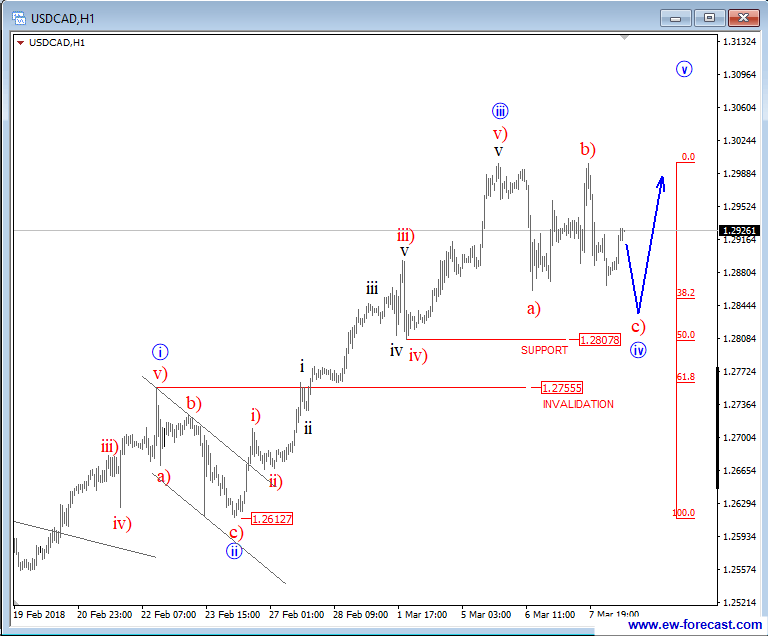
USDCAD came nicely lower since yesterday; it looks like a wave c) of a three wave structure in wave four which can already be searching for support this morning. Ideally a bounce will come from around 1.2850, while pair trades above 1.2755 invalidation mark.
USDCAD, 1H
Become a Successful Trader and Master Elliott Wave like a Pro. Start your Free 14 Day Trial at - Elliott Wave Forecast.
Author

Gregor Horvat
Wavetraders
Experience Grega is based in Slovenia and has been in the Forex market since 2003.


