Economic stimulus…not yet [Video]
![Economic stimulus…not yet [Video]](https://editorial.fxstreet.com/images/Markets/Equities/SP500/wall_street_nyse3-637299021683820849.jpg)
US Dollar: Dec '20 USD Up at 93.215.
Energies: Nov'20 Crude is Down at 40.02.
Financials: The Dec '20 30 year bond is Up 6 ticks and trading at 174.07.
Indices: The Dec S&P 500 emini ES contract is 45 ticks Higher and trading at 3484.50.
Gold: The Dec'20 Gold contract is trading Down at 1925.00 Gold is 10 ticks Lower than its close.
Initial Conclusion
This is not a correlated market. The dollar is Up+ and Crude is Down- which is normal and the 30 year Bond is trading Higher. The Financials should always correlate with the US dollar such that if the dollar is lower then bonds should follow and vice-versa. The S&P is Higher and Crude is trading Lower which is correlated. Gold is trading Lower which is correlated with the US dollar trading Up. I tend to believe that Gold has an inverse relationship with the US Dollar as when the US Dollar is down, Gold tends to rise in value and vice-versa. Think of it as a seesaw, when one is up the other should be down. I point this out to you to make you aware that when we don't have a correlated market, it means something is wrong. As traders you need to be aware of this and proceed with your eyes wide open.
Asia traded mainly Higher with the exception of the Japanese Nikkei. Currently Europe is trading mainly Higher with the exception of the London and the Spanish Ibex exchanges which are fractionally Lower at this time.
Possible Challenges To Traders Today
-
No major economic news to speak of.
-
Lack of Major Economic News.
Treasuries
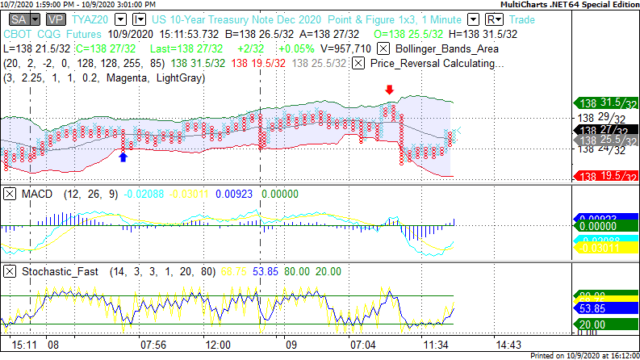
Traders please note that we've changed the Bond instrument from the 30 year (ZB) to the 10 year (ZN). They work exactly the same.
We've elected to switch gears a bit and show correlation between the 10 year bond (ZN) and The S&P futures contract. The S&P contract is the Standard and Poor's and the purpose is to show reverse correlation between the two instruments. Remember it's liken to a seesaw, when up goes up the other should go down and vice versa.
On Friday the ZN made it's move at around 10 AM EST. The ZN hit a High at around that time and the S&P moved Higher. If you look at the charts below ZN gave a signal at around 10 AM EST and the S&P moved Higher at around the same time. Look at the charts below and you'll see a pattern for both assets. ZN hit a High at around 10 AM EST and the S&P was moving Higher shortly thereafter. These charts represent the newest version of MultiCharts and I've changed the timeframe to a 15 minute chart to display better. This represented a Shorting opportunity on the 10 year bond, as a trader you could have netted about 20 ticks per contract on this trade. Each tick is worth $15.625. Please note: the front month for the ZN is now Dec '20. The S&P contract is also Dec '20 as well. I've changed the format to Renko bars such that it may be more apparent and visible.
Charts Courtesy of MultiCharts built on an AMP platform

Bias
On Friday we gave the markets a Neutral bias as we didn't see much evidence for Market Correlation. The Dow gained 161 points and the other indices gained ground as well. Today we aren't dealing with a correlated market and our bias is Neutral.
Could this change? Of Course. Remember anything can happen in a volatile market.
Commentary
So now the question in everyone's mind is if or perhaps when will the American people see a stimulus package pass? Its a confusing situation so we will try to explain as best we can. Earlier in the week President shot down the idea of stimulus package prior to the election and that is of course with the understanding that he would be reelected. But because of the political backlash Trump reneged and decided to endorse the "skinny" stimulus which didn't have much meat on it. Speaker Pelosi has shot down the idea of the skinny stimulus as it didn't or doesn't cover enough. Meanwhile in the Senate Mitch McConnell who is the Senate Majority Leader ha shot down the idea of any stimulus as he sticking to the GOP party line of irresponsible spending. In the meantime this past week Fed Chair Powell has stated that now is the time to act, yet all of it has fallen on deaf ears. I never thought I'd see the day when the US Congress is no negligent with the American people, but there you have it folks and who suffers? Mr. and Mrs. America....
On Thursday April 5 (2018) we had the honor and privilege to be interviewed by David Lincoln on his You Tube channel. David is a floor trader for the options markets. If you listen to this interview, you will enjoy it. To view the interview go to:
Author

Nick Mastrandrea
Market Tea Leaves
Nick Mastrandrea over 20 years experience in trading and formerly held a NASD Series 7. He currently holds a NJ Life, Health and Variable Authority. Nick is a published writer and his work has appeared in Futures Magazine, TraderPlanet and others.


