Eco news propels markets [Video]
![Eco news propels markets [Video]](https://editorial.fxstreet.com/images/Markets/Equities/market-analyze-18914145_XtraLarge.jpg)
US Dollar: Dec '20 USD Up at 92.370.
Energies: Nov'20 Crude is Up at 42.03.
Financials: The Dec '20 30 year bond is Up 14 ticks and trading at 173.22
Indices: The Dec S&P 500 emini ES contract is 24 ticks Lower and trading at 3574.00.
Gold: The Dec'20 Gold contract is trading Up at 1865.50 Gold is 42 ticks Higher than its close.
Initial Conclusion
This is not a correlated market. The dollar is Up+ and Crude is Up+ which is not normal and the 30 year Bond is trading Higher. The Financials should always correlate with the US dollar such that if the dollar is lower then bonds should follow and vice-versa. The S&P is Lower and Crude is trading Higher which is correlated. Gold is trading Higher which is not correlated with the US dollar trading Up+. I tend to believe that Gold has an inverse relationship with the US Dollar as when the US Dollar is down, Gold tends to rise in value and vice-versa. Think of it as a seesaw, when one is up the other should be down. I point this out to you to make you aware that when we don't have a correlated market, it means something is wrong. As traders you need to be aware of this and proceed with your eyes wide open.
Asia traded mainly Higher with the exception of the Japanese Nikkei exchange which is Lower. All of Europe is trading Higher at this time.
Possible Challenges To Traders Today
-
FOMC Member Kaplan Speaks at 8:30 AM EST. This is Major.
-
No major economic news to speak of.
-
Lack of Major economic news.
Treasuries
Traders please note that we've changed the Bond instrument from the 30 year (ZB) to the 10 year (ZN). They work exactly the same.
We've elected to switch gears a bit and show correlation between the 10 year bond (ZN) and The S&P futures contract. The S&P contract is the Standard and Poor's and the purpose is to show reverse correlation between the two instruments. Remember it's liken to a seesaw, when up goes up the other should go down and vice versa.
Yesterday the ZN made it's move at around 8 AM EST. The ZN hit a Low at around that time and the S&P moved Lower. If you look at the charts below ZN gave a signal at around 8 AM EST and the S&P moved Lower at around the same time. Look at the charts below and you'll see a pattern for both assets. ZN hit a Low at around 8 AM EST and the S&P was moving Lower shortly thereafter. These charts represent the newest version of MultiCharts and I've changed the timeframe to a 15 minute chart to display better. This represented a Shorting opportunity on the 10 year note, as a trader you could have netted about a dozen ticks per contract on this trade. Each tick is worth $15.625. Please note: the front month for the ZN is now Dec '20. The S&P contract is also Dec '20 as well. I've changed the format to Renko bars such that it may be more apparent and visible.
Charts Courtesy of MultiCharts built on an AMP platform
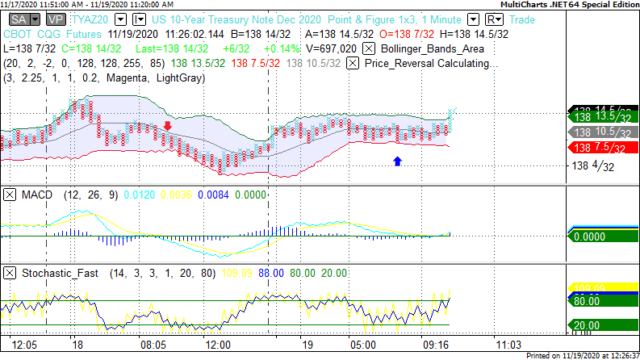
ZN - Dec 2020 - 11/19/20
-637414673268770691.png)
S&P - Dec 2020 - 11/19/20
Bias
Yesterday we gave the markets an Downside bias as both the USD and teh Bonds were trading Higher and this usually represents a Downside day. The markets however had other ideas as the the Dow gained 45 points and the other indices gained ground as well. Today we aren't dealing with a correlated market and our bias is Neutral.
Could this change? Of Course. Remember anything can happen in a volatile market.
Commentary
Yesterday we once again awoke to the notion of this being an ordinary day. In the early AM the markets were correlated to the Downside. So what happened as the markets closed Higher? One of the things that we always say in this newsletter is "this can change" So what changed? The economic news reported. Philly Fed Manufacturing Index beat expectation, Existing Home Sales beat expectation. This gave the markets the impetus to propel forward and it did. Not by much mind you but it did. Today we have no real economic news to speak of so the markets will be left to its own devices. Will it move forward?
Author

Nick Mastrandrea
Market Tea Leaves


