Earnings Season Starts

Good Morning Traders,
As of this writing 3:50 AM EST, here’s what we see:
US Dollar: Jun. USD is Down at 89.445.
Energies: May '18 Crude is Down at 66.37.
Financials: The June 30 year bond is Down 17 ticks and trading at 144.28.
Indices: The June S&P 500 emini ES contract is 32 ticks Higher and trading at 2665.25.
Gold: The June gold contract is trading Down at 1345.90. Gold is 20 ticks Lower than its close.
Initial Conclusion
This is not a correlated market. The dollar is Down- and Crude is Down- which is not normal and the 30 year Bond is trading Lower. The Financials should always correlate with the US dollar such that if the dollar is lower then bonds should follow and vice-versa. The S&P is Higher+ and Crude is trading Lower- which is correlated. Gold is trading Down- which is not correlated with the US dollar trading Down-. I tend to believe that Gold has an inverse relationship with the US Dollar as when the US Dollar is down, Gold tends to rise in value and vice-versa. Think of it as a seesaw, when one is up the other should be down. I point this out to you to make you aware that when we don't have a correlated market, it means something is wrong. As traders you need to be aware of this and proceed with your eyes wide open.
At this hour all of Asia is trading mainly Lower with the exception of the Nikkei exchange which is Higher. All of Europe is trading Higher with the exception of the London exchange which is Lower at this time.
Possible Challenges To Traders Today
-
Core Retail Sales are out at 8:30 AM EST. This is major.
-
Retail Sales are out at 8:30 AM EST. This is major.
-
Empire State Mfg Index is out at 8:30 AM EST. This is major.
-
Business Inventories is out at 10 AM EST. This is not major.
-
NAHB Housing Market Index is out at 10 AM EST. Major.
-
FOMC Member Bostic Speaks at 1:15 PM. This is major.
-
TIC Long-Term Purchases is out at 4 PM EST. This is not major.
Treasuries
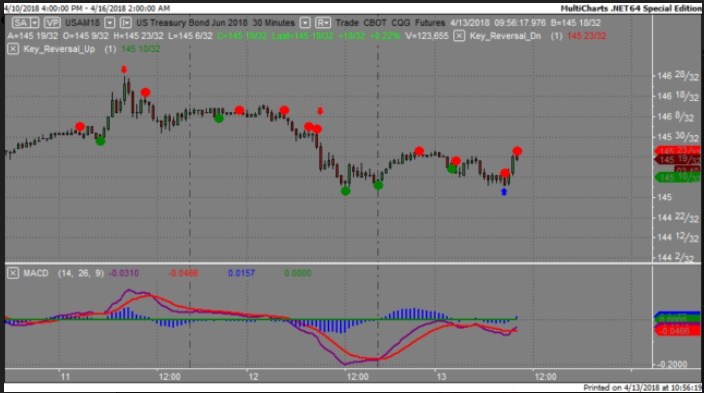
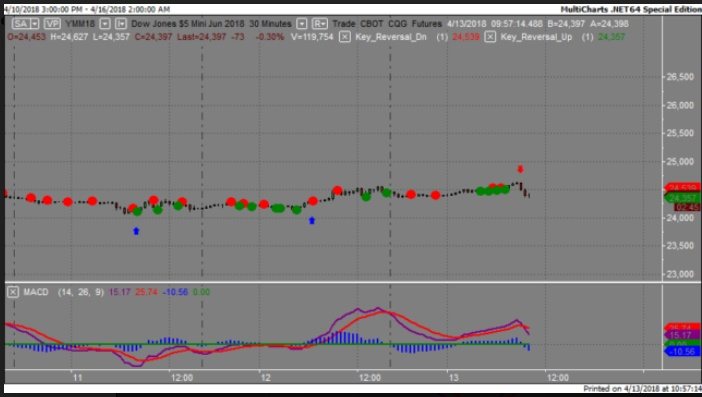
We've elected to switch gears a bit and show correlation between the 30 year bond (ZB) and The YM futures contract. The YM contract is the DJIA and the purpose is to show reverse correlation between the two instruments. Remember it's liken to a seesaw, when up goes up the other should go down and vice versa.
On Friday the ZB made it's move at around 8:30 AM EST. The ZB hit a Low at around that time and the YM hit a High. If you look at the charts below ZB gave a signal at around 8:30 AM EST and the YM was moving Lower at the same time. Look at the charts below and you'll see a pattern for both assets. ZB hit a Low at around 8:30 AM and the YM hit a High. These charts represent the newest version of MultiCharts and I've changed the timeframe to a 30 minute chart to display better. This represented a shorting opportunity on the 30 year bond, as a trader you could have netted about 15 plus ticks per contract on this trade. Each tick is worth $31.25.
Charts Courtesy of MultiCharts built on an AMP platform.
Bias
On Friday we gave the markets a Neutral bias as the USD, Crude and Gold were all trading Higher Friday morning. However the S&P was also trading Higher which led us to give a Neutral bias. The Dow dropped by 123 points and the other indices lost ground as well. Today we aren't dealing with a correlated market and our bias is to the Upside.
Could this change? Of Course. Remember anything can happen in a volatile market.
Commentary
Friday started as any trading day would start however it was announced that the US had attacked Syria via airstrikes. The reason given was Syria's President Assad had used chemical weapons (gas) against his own people and this was not acceptable to the United States. This immediately led to more market turmoil as Russia decided to get in the act and admonish the US's act of aggression against Syria. Any time there is a geopolitical event anywhere there's always a ramification to the markets. unfortunately these events are unpredictable. This week earnings season starts and in the past that meant Alcoa would report first, however Alcoa will report on Wednesday, the 18th.
Author

Nick Mastrandrea
Market Tea Leaves


