Dow Theory sell signals are starting to emerge

DOW THEORY
You are probably going to hear a lot about Dow Theory in the coming days and weeks. Just like the "death crosses" that have been occurring in several broad market indices, Dow Theory sell signals are starting to emerge. So what is the Dow Theory?
According to Investopedia, "The Dow theory is a theory which says the market is in an upward trend if one of its averages (industrial or transportation) advances above a previous important high and is accompanied or followed by a similar advance in the other average. For example, if the Dow Jones Industrial Average (DJIA) climbs to an intermediate high, the Dow Jones Transportation Average (DJTA) is expected to follow suit within a reasonable period of time."
One of the key tenets of the Dow theory is that both averages, the Industrials and the Transports, confirm one another. This means that a positive trend is one in which each index is making a series of higher highs and higher lows. A negative trend occurs when each index is making a series of lower highs and lower lows. As simple as this seems, buy and sell signals are actually rather subjective and are often disputed among Dow Theorists.
Charles Dow understood the importance of confirmation and also believed that the averages discounted everything. According to the Dow Theory, the market has three trends: primary or longterm trends (trends lasting more than 1 year), secondary trends (typically reactions against the primary trend that last 3 weeks to 3 months), and minor trends (generally lasting less than three weeks). It is often the most difficult to determine whether a reversal is a secondary trend or a new primary trend. This is where strategists tend to disagree the most.
We look at the Dow Theory because of its history and the fact that it is a trend following discipline. Like other practitioners we have our own "twist" to applying the discipline. We use weekly exponential moving average crossovers on both the Dow Jones Industrial and the Dow Jones Transportation indices. Specifically when the 13 week exponential moving average is below the 21 week exponential moving average on either index, we classify that as a negative trend. When the 13 week moving average is above the 21 week moving average, we determine that as a positive trend. Therefore, a Dow Theory buy signal occurs when both the Dow Transports and the Dow Industrial indices are in positive trends and a sell signal occurs when both are in negative trends.
Currently, The Dow Jones Industrials index and the Dow Jones Transportation index are both in negative trends according to the 13-21 weekly exponential moving average crossover. This is consistent with our belief that we are experiencing a trend reversal in the overall market and general economy. We are also witnessing a similar phenomenon that has occurred at multiple tops in the broad market. The Dow Transports index is leading the way down.
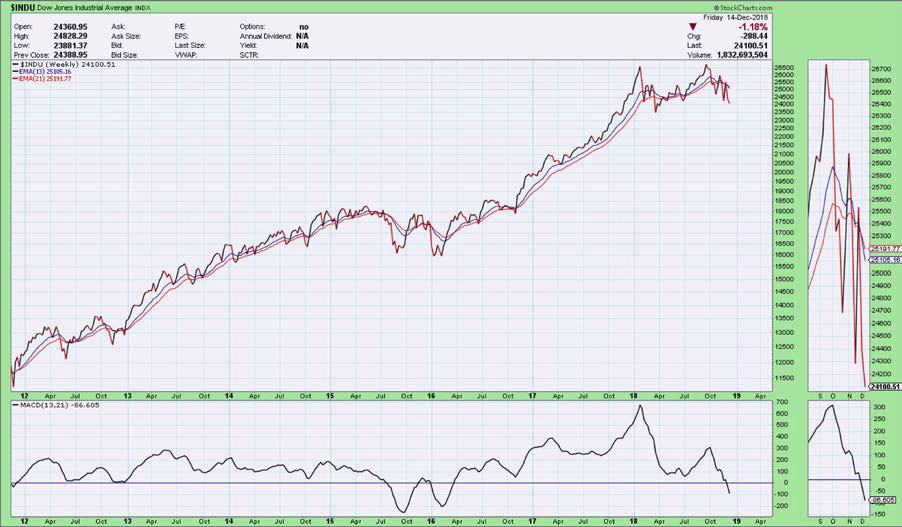
Chart 1: Dow Jones Industrial Average
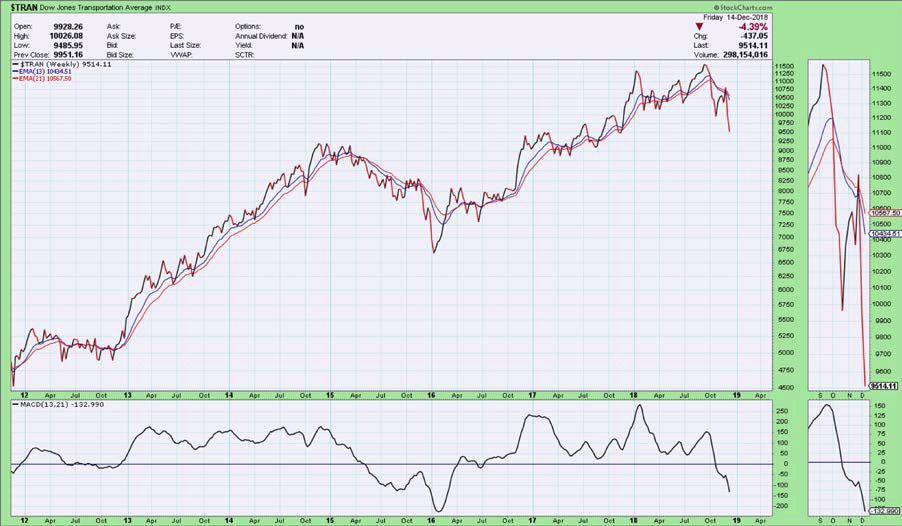
Chart 2: Dow Jones Transportation Average
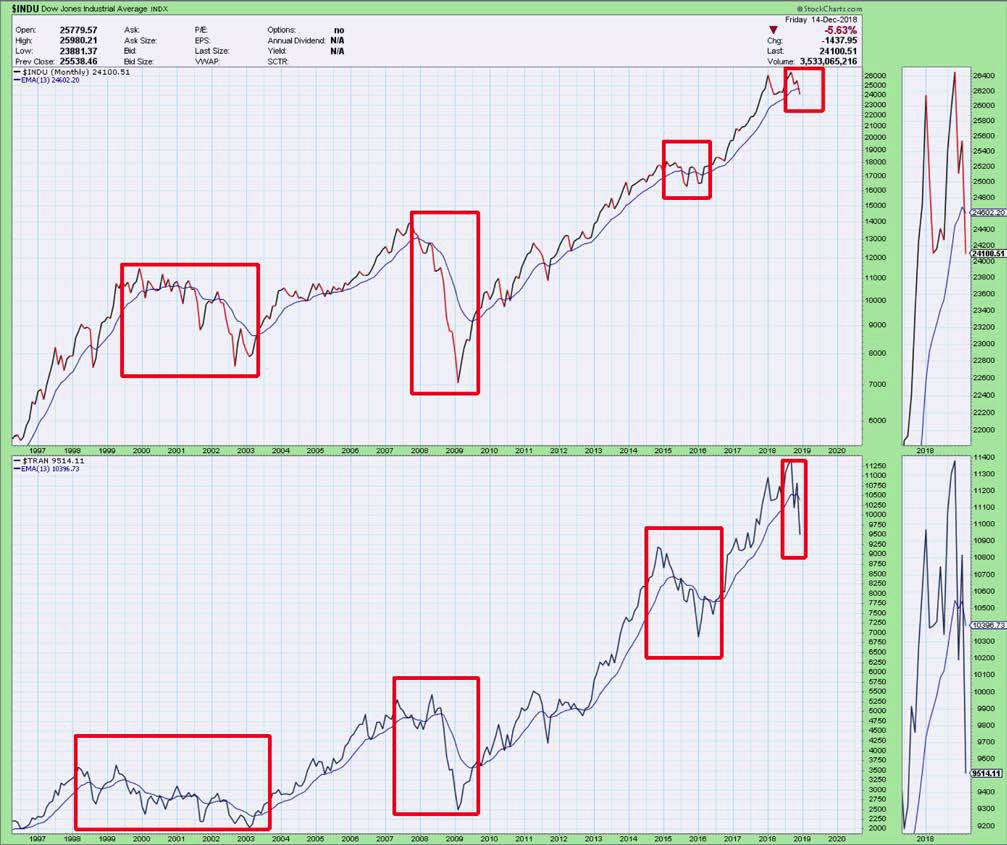
Chart 3: This chart illustrates other times in history where the Transports index broke down ahead of the Industrials index. We are experiencing something similar this time around.
The Dow Theory is consistent with our opinion that market participants should move to their defensive playbook. We don't believe this necessarily means moving out of the market completely. Rather, we think there are opportunities, even in the equities markets. Our recommendation is to revisit risk levels and make sure you are comfortable with a significant drawdown (>50%).
Author

Clint Sorenson, CFA, CMT
WealthShield


